Share Your Best Dashboards!

Your dashboards are awesome. So awesome, that it'd be a crime to keep them to yourselves.


We'll cut right to the chase - there's only one thing we want to see, and that's your dashboards! This is why we're inviting all Cube VIPs to share images of their BEST dashboards. We know there are some phenomenal dashboards out there, and it would be a real shame if they remain hidden any longer.


So what do you have to do?


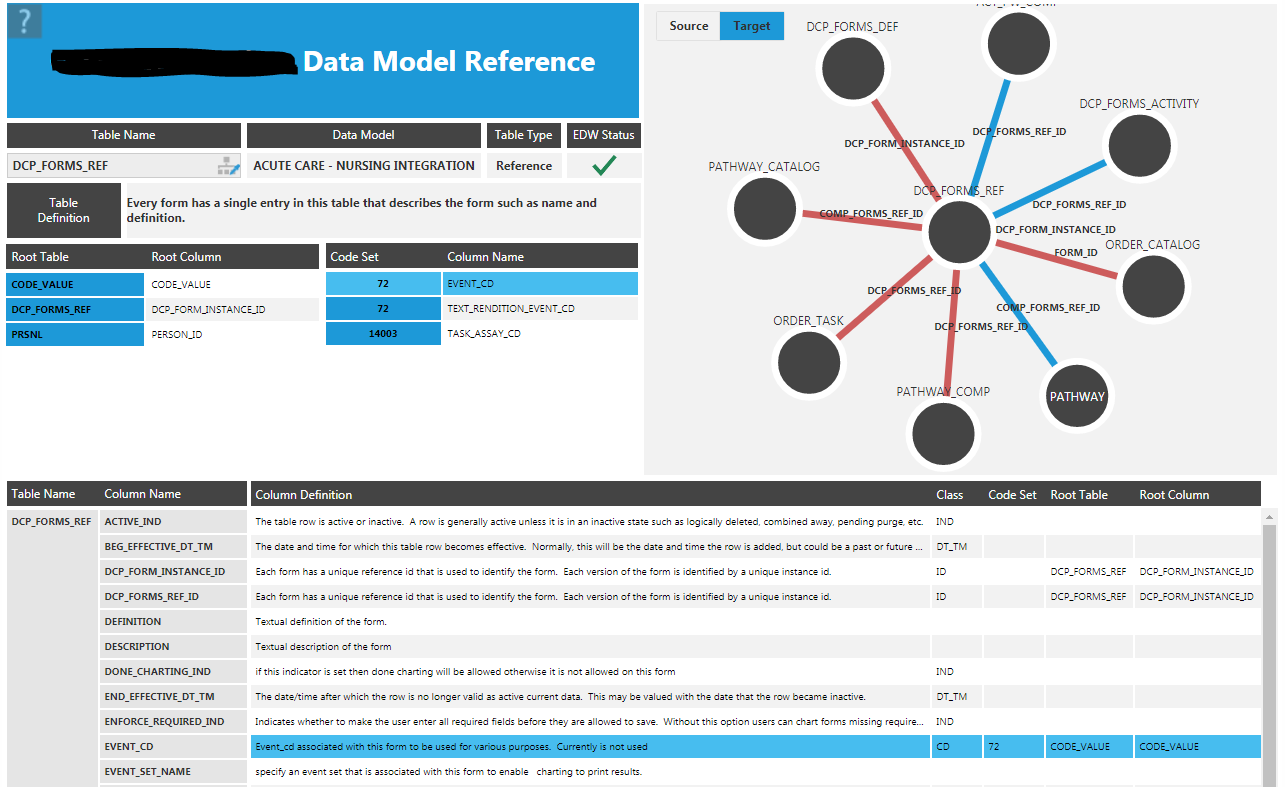
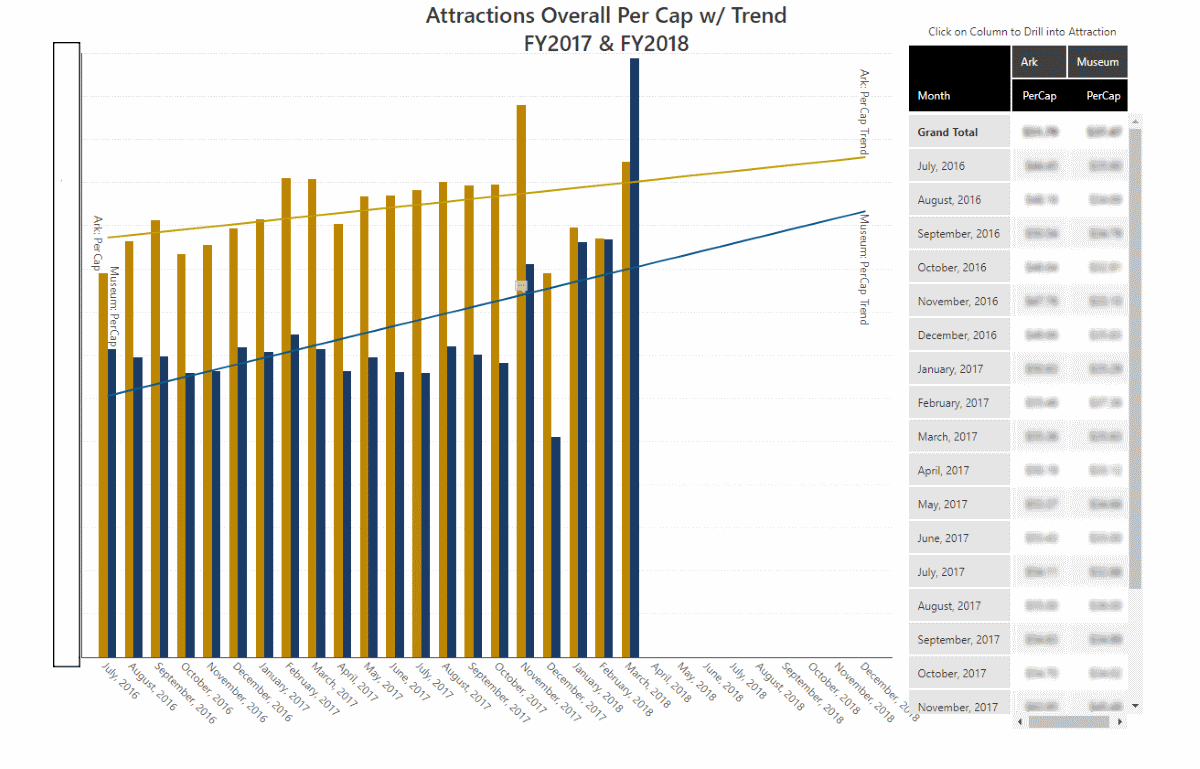
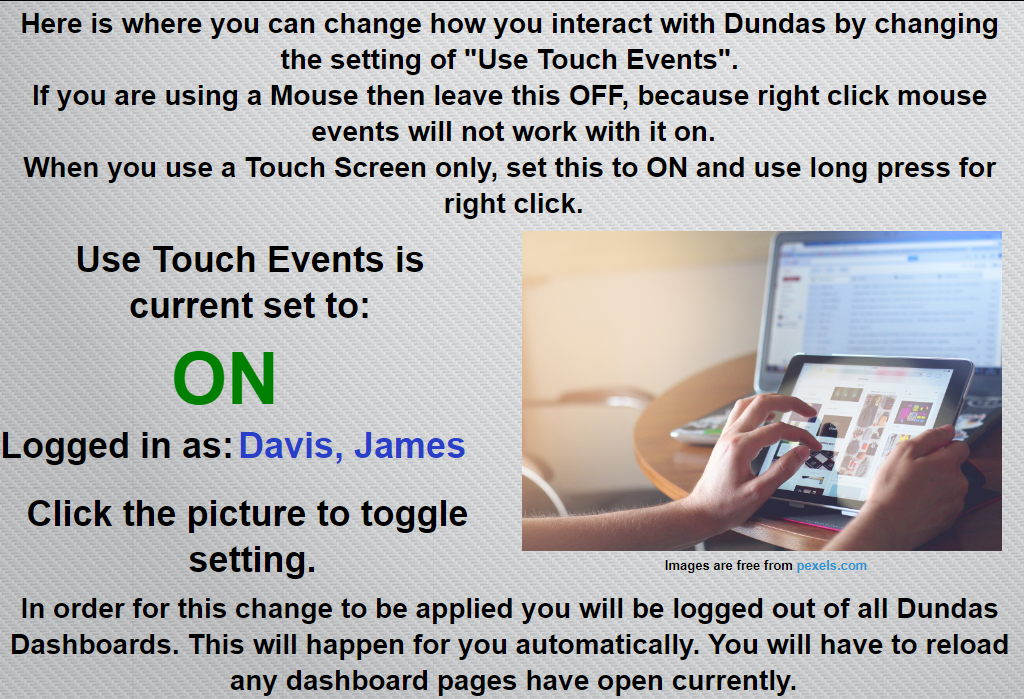
Simply upload a screenshot of your favorite dashboard(s) that you've created in Dundas BI, sit back, relax, and bask in all the compliments you're certain to receive!


You can upload a screenshot of your dashboard(s) via the Upload Image icon:


Once you've published your dashboard, feel free to explain to the community what you were trying to achieve. What approach did you take and why? What business problem are you attempting to solve?


What's in it for you?


We'll award 150 points to each VIP who contributes an example of their dashboard(s). PLUS, by adding to this thread, we'll be creating a repository of some fantastic Dundas BI dashboards, that Cube VIPs can learn and be inspired from. Who knows, you may even find your next great dashboard idea here...


--


We also know that many of your dashboards feature confidential information, so by all means, you can use sample data to showcase your creativity if you'd like.


Dashboards shared in this thread will remain IN THE CUBE. We will NOT share these outside of The Cube unless permission is specifically granted by you.


--


So have at it. Let's see your awesome dashboards!


We replaced a map that was built by our developers that looked eactly like this but it required development time if we wanted to make any changes. Now we can update and tinker with it as much as we want to make it more useful. The prices update in near real time changing the color of the price points according the states we setup, creating a visually interesting view.

4 Likes

How do you set up 'near real time'? Where is the data coming from and how do you handle limits on connections?

I have a dashboard that pulls API data and luckily they don't want more than once a day updates.

This dashboard shows a statistical analysis of the tax foreclosures process pendency in a form of a Box plot and an Histogram. Basically, it tells the duration of a tax foreclosure process takes until is concluded. It has some interaction from the Box plot to the Histogram. It has also a help overlay that gives information of what each visualizations means.


3 Likes

This is a dashboard I made to help developers interactively explore the rather large and complex EMR database of our hospital. The data comes from metadata tables brought into a SQL Server data warehouse from the source system. Design-wise it is pretty simple, but it has some handy features. Basically you search for one of the ~40,000 tables by name, and then it will provide column definitions, a list of foreign key relationships, an indicator to let users know if the table has been warehoused or not, and a sweet network diagram that visualizes a simplified data model. Users can also click on any 'coded' value (a system assigned numeric identifier) and it will do a lookup for its plain-English description (what a user sees on the front-end). It also lets you do a sort of 'reverse-lookup' whereby if you know some field in a front-end application, you can search for it by name and find out the corresponding coded value, and thus its source table in the database.


3 Likes


This is one of the dashboards that we build to one of our customers for IT helpdesk, we took into considaration to be pixel perfect design with looking to many KPIs in one dashboard.

5 Likes

Drillable monthly data in addition to visualization

Per capita sales is an important matrix in theme park operations. When watching month-to-month figures and longer term trends there may be times when something looks "off", such as the blue bar above suddenly catching up to and then passing the gold bar. Rather than drilling into the visualization and losing the trend, we've provided the monthly values on the right, which are drillable to the daily level so that anomalies can be identified or meaningful changes can be pin pointed and explained / anotated.

1 Like

I made a dashboard utilizing a stored procedure and multiple scripts to move data from one table to another.

1 Like

OK I been wanting to share here for a while but every dashboard I make has personal information, company finacial data, project stats or all of the above on it and when I do take a picture and redact the information it just does not work out. Maybe one day I fiddle with copying the data base schema and filling it with fake data but for now I made one finaly that does not have data on it it is a helper dashboard that can be used for users that just view dashboards via SharePoint (or some other embbeded way) and never actually log into the Dundas site.


This is my change Use Touch Events setting dashboard for those users that never see the left menu bat and cannot change it.


There are three scripts:

To change the User and set the ON OFF is an dashboard Ready script

user.control[0].innerText = dundas.context.currentSession.accountDisplayName;
user.control[0].style.color = "#2A3FC9"
if (window.localStorage.getItem("isTouchEnabled") == "true")
{
touchStatus.control[0].innerText = "ON"
touchStatus.control[0].style.color = "Green"
touchON.hidden = false;
touchOFF.hidden = true;
}
else
{
touchStatus.control[0].innerText = "OFF"
touchStatus.control[0].style.color = "Red"
touchON.hidden = true;
touchOFF.hidden = false;
}


To change the setting I put it On click on a tranparent box over the two pictures (instead of on each picture)

function wait() {
var a = 1;
var b = 2;
var c = a + b;
}
if (window.localStorage.getItem("isTouchEnabled") == "true")
{
touchON.hidden = true;
touchOFF.hidden = false;
window.localStorage.setItem("isTouchEnabled",!1);
touchStatus.control[0].innerText = "OFF"
touchStatus.control[0].style.color = "Red"
}
else
{
touchOFF.hidden = true;
touchON.hidden = false;
window.localStorage.setItem("isTouchEnabled",!0);
touchStatus.control[0].innerText = "ON"
touchStatus.control[0].style.color = "Green"
}
//dundas.context.currentSession.validUntil = Date.now();
this.getService("WebAppService").logOff();
setInterval( function() { window.location.replace("www.aPageThatTellsYouReloadDashboardsYouHaveOpen.com"); }, 2000);


1 Like

Quick verification question:

Is this setting stored in a cookie or browser session variable?


It's stored in the localStorage of the browser. However, an advice from our developers is that this should be accessed through our utility rather than directly as you did.


Example to check the value:

if (dundas.Utility.isTouchEnabled()) {

} else {

}


Example to set the value:

dundas.Utility.isTouchEnabled(true);

or

dundas.Utility.isTouchEnabled(false);

This is one of our demo dashboards that I have just finished working on. It utilises completely fictitious data and is an example of brand health dashboards. We did get a graphics designer to assist with the design, but they are not experienced in designing data vizualisations just websites and images. Still, it does look better than we would have come up with ourselves.

3 Likes

2 Likes

Your sample is very nice but I would like to point out that since Dundas BI 5.0.1 we have greatly enhanced the detection logic so I hope this kind of setup won’t be frequently needed by the users any longer. Did you notice any change since that version?

I do not have a touch screen myself so i will have to ask someone with one to see how it working.
What detection logic are you talking about?
The issue I made this to solve was when a user has a touchscreen but is using a mouse and not the touchscreen. What was happening is that right click events did not work while the Touch Event was on.

You may still need your solution in place but prior to V5.0.1 the default detection of Dundas BI in regards to current device (touch or not) the user is using for that session wasn’t as accurate as the new detection logic.

I think you are right.
You are talking about whether or not it detects a touchscreen and I am got this for when it does detect it but you use a mouse and not the touchscreen (and the menu bar is hidden so they cannot click their profile to change it).

If you can make Dundas detect that yes there is a touchscreen but the user is using a mouse that is what would make my solution obsolete. (Honestly do not make that a priority if you do make a Feature Request please put that at the bottom of the list, my solution works fine and so does being able to turn it off via the profile for the users that can see the left menu bar and get to their profile).

How did you change the styling of your filters? (I’m assuming that’s what the All Markets/All Segments arrows are for) Or are they just images scripted to display a dropdown list?

The dashboard shows the change in HPI over past periods and allows the user to change the filter values, also integrated is another dashboard which shows the overall charts for the change HPI and Benchmark Price over time.

1 Like

This was actually our goal, but unfortunately in JavaScript you can’t detect whether or not there’s an actual touch screen and the kind of HID being used. All you get is a ‘tap’ event, or a ‘click’ event (or in the case of IE/Edge, both or possibly ‘ontouchstart’).

This makes it painfully difficult to know what kind of event to listen to across the entire application, where listening to both isn’t a good option (as you sometimes will get both and may execute logic twice, or in an indeterminate order).

As Ariel mentioned, in v5.0.1 we fine-tuned this detection and dropped the option in the profile altogether for IE/Edge by attempting to better detect the device / browser. This solved most of the cases, but not all. If you use a mouse hooked up to a Surface tablet with Chrome, for example, then touch is enabled, but you may get both events and would need to constantly listen to both (they can switch at any moment). With IE/Edge it will work as expected.

It’s a challenge that we continue to work on to improve with each version.