Great thread here Kris and everyone!
DBI Cheats
I am relatively new to Dundas BI software, and would love to see that latest "Cheat Sheets" compiled into a PDF to download and use to speed up the learning curve for new users. Update it once a month with the latest "cheats" and make available to download to VIP users here on The Cube.
1 Like
This tip is not in the core of dundas BI but very useful when you build your dashobards, its a KPI library from ServiceNow in some areas but very very helpful:
The Link is: http://kpilibrary.com/
More cheats are more better. I'm more of an analyst than a JS scripter, so a few cool scripts go a long way for me.
1 Like
Dashboards in Different Languages
In the following Dashboard sample - https://multilang.dundas.com/Dashboard/f78d570f-1896-441e-9b5e-90e0999db630?e=false&vo=viewonly - you're able to change the language by selecting one of the various flags.
We love this feature, and a few Cube VIPs have been asking how to define this, so without further ado:
--
To get dashboards in different languages there are 3 type of objects to translate:
1 - Dundas BI fixed buttons and menus: This includes the different buttons on the toolbar, context (right click) menu and any messages provided by application. Depending on your implementation you may not need to translate those (i.e. if you embed the dashboard in full screen mode and prevent users from accessing the toolbar or context menu). If you do want users to be able to access those options you will need to provide the translations by setting the users culture to the right language as detailed under
2 - The text of the design elements you placed on your dashboard: This includes labels, buttons, tooltips and any text you configured while creating your dashboards using the different properties. To translate this text you will typically want to define a script on the dashboard loading actions that will detect the current culture defined for the dashboard and then apply the right text for the different elements to match the respective culture (language)
To detect the current culture set for the session you can use the following value in your JavaScript: dundas.context.currentSession.cultureName in example, the following script will change the text of label1 from English to French:
if(dundas.context.currentSession.cultureName == "en-US")
{
label1.labelText = "Hello";
}
else
{
label1.labelText = "Bonjour";
}
Using this type of script you can also control formats and other language related formatting that you may want to change per language and per dashboard.
If you are new to scripting in Dundas BI you should start under: http://www.dundas.com/support/support-center/support-articles/scripting/writing-scripts-using-browser-developer-tools
3 - Data points values: This include all the data retrieved that you would like to translate (i.e. one of your query shows the top products in English and you would like to show those products names in French). While often, there is no need to translate those values (as the business users would rather have it using a single language), depending on the data source there are different ways to handle those translations. For example, if you are using SQL Server Analysis Services OLAP cubes as your source then you can provide the translations in the actual OLAP cube definitions and then Dundas BI will pick it up using the culture settings (so no extra configuration except for #1 above is required). For other sources, it may be easier to hold a copy of the database with the same structure but the different language value and dynamically connect to the right database using the tenant data connection override: http://www.dundas.com/support/learning/documentation/administration/using-tenant-data-connector-overrides.
Other options would be to use manual queries in the data cube that translate the values based on the culture value of that session using case statements.
Great idea Christopher! This is definitely something we can work on.
I am excited to read this as our organization is just launching our training.
I love this video! Thank you!
Great post? Thanks for the tips.
Liked
Very nice Andy - I missed it when you orignally posted it. Here is a small example of how it would look using your script (click the image): 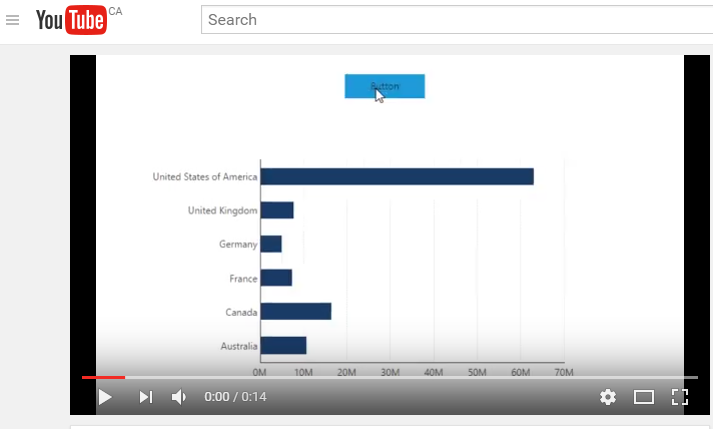
Can you share the use case where you used it?
Tried this but was able to see only data for the current series/measure I'm hovering and didn't find a way to get the other series. Also it actually gets the mouse position only if the cursor is exactly on top of the line chart.
Didn't work for me even with support of Dundas team as we were using bridge parameters.
I was really just stretching my legs to see what I could do. I'm new to javascript, and our other developers use greensock in our custom webapps, so I decided to see if I could integrate that into Dundas BI. I could manipulate charts and individual components easily, but ran into a snag when I wanted to group some objects and move the single group.
Looks great, noticed the link didn't work for me because of the /master/ in it
Hi Toufik, the sample script is meant to read the values of the data points under the location of the mouse. If you would like to get to the value of a different series, then you need to position the mouse over that series.
You can also get access to the entire cellset being shown on a chart using chart1.metricSetBindings[0].dataResult.cellset.rows or chart1.metricSetBindings[0].dataResult.cellset.cells
I know but accessing that whole dataset will not be aligned with current mouse position.
I want to be able move the mouse anywhere and show on a couple of labels the X axis value and the values of all series corrzsponsing to the same x axis value.
Instead of hitTest(), you can get the index of the entire row corresponding with the mouse position with:
e.relatedData.rows[0]
Then, you can access each cell value in this row:
chart1.metricSetBindings[0].dataResult.cellset.cells[measureIndex][rowIndex].value
where [measureIndex] is e.relatedData.columns[0] and [rowIndex] is e.relatedData.rows[0]
For example:
var row = e.relatedData.rows[0];
var xValue = "";
chart1.metricSetBindings[0].dataResult.cellset.cells.forEach(function(measure){xValue += "/"+ parseFloat(measure[row].value);});
label.labelText = xValue;
Controlling Left Axis scale with Right Axis
I had a need for a bar and line chart in one graph with the Left X Axis for the bars (big numbers) and the Right X Axis for the line (small numbers). Once I got all that worked out the scaling for the line graph was following its own rules and looking as big bar chart numbers. I found the "Share the scale with another chart or axis" but this made it so the line part of the graph was just a striaght line at the bottom.
What I needed was for the Left Axis to be controlled by the Right Axis but by a factor.
This is what I came up with and it woking quite nicely.
On the chart Data Changed script (put here because like most chart it has a filter and the right axis scale changes depending on what is selected).
Put this simple script:
chart1.control.y2Axes["0"].autoMaximumLowerLimit = chart1.control.yAxes["0"].actualMaximum/2;
I at first had this to help me dig into all the parts (using the Browser developer tools) and figure out what is was I needed to do.
debugger;
var axesRight = chart1.control.y2Axes;
var axesLeft = chart1.control.yAxes;
var max = axesLeft["0"].actualMaximum; //so I could run in debugger and see the value, looked at many different things with that.
axesRight["0"].autoMaximumLowerLimit = axesLeft["0"].actualMaximum/2;
You might not need this one linner script but the process that I went trough to find what I was looking for might be what you need. By looking at the API Docs and saying that sounds like what I need but it was not when I actually ran it in the debugger and saw that not the value I am expecting. Then going back through the list (some times the list is short and others there are a lot of simular sounding like in dundas.controls.ChartAxis).
Reminder: Try to remeber to cleaned up your "Trying Things Out Code" into production code.
The link is not there any more :(