Jeff’s got a new video out on log scales - "You Can’t Flatten the Curve Without Log Scales". Tell us how you have used log scales and share some samples with us. We’d love to see them.
You Can't Flatten the Curve Without Log Scales
1 Like
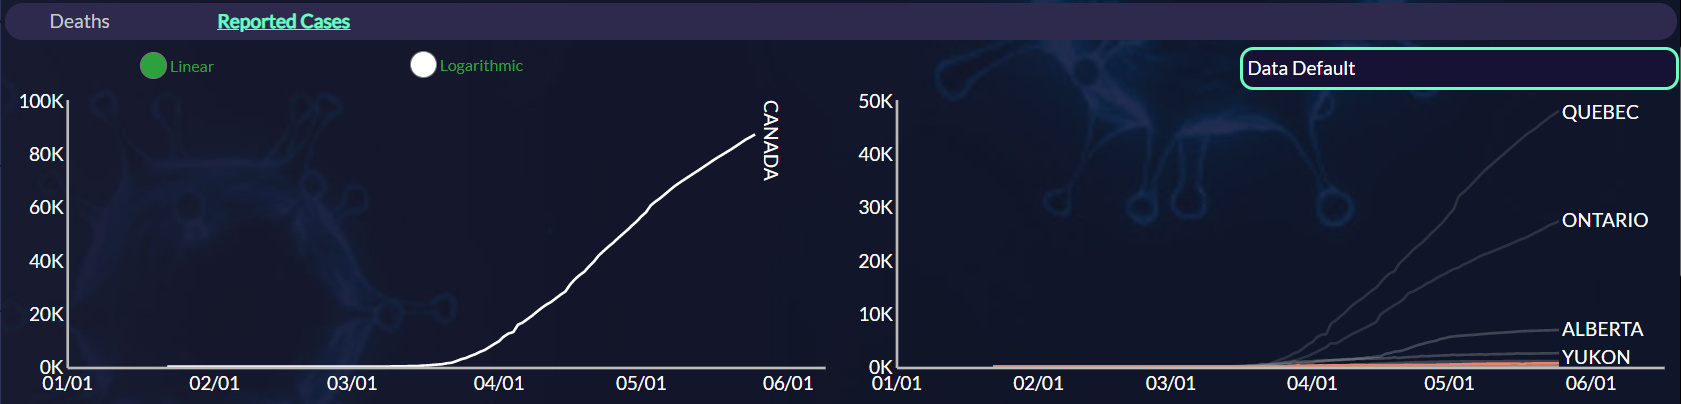
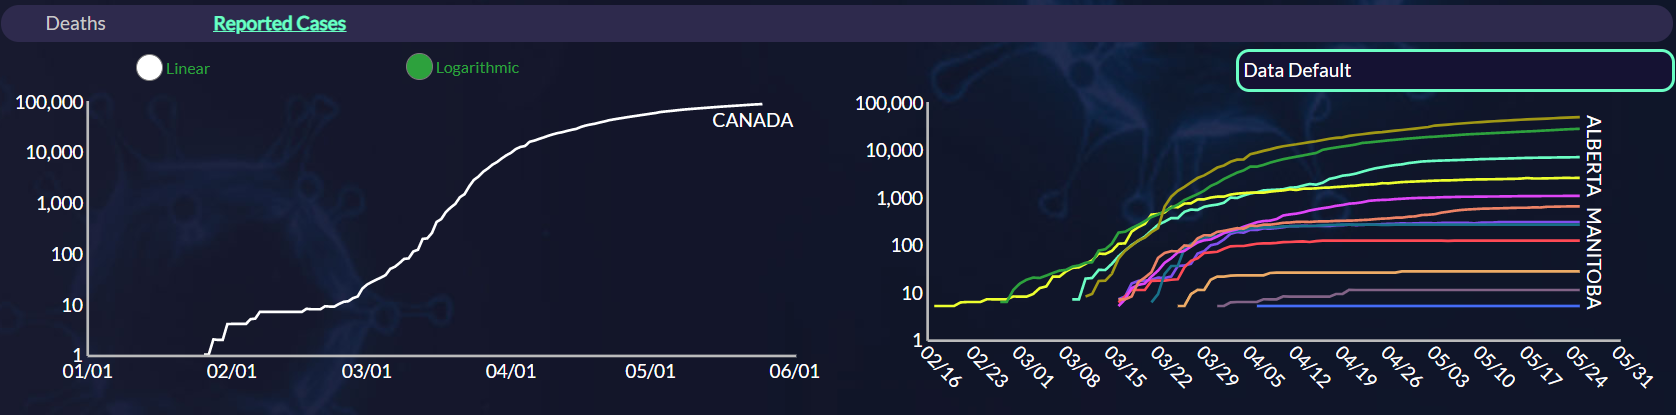
Our Covid-19 dashboard has the ability to toggle between both a Linear Scale and Logarithmic Scale using a radio button. This gives the user the ability to see the perspective that is most suited to their needs. See how in the second image you can see a lot more detail about the different provinces in the log scale? The downside, of course, is that it makes it look like the cases are similar in quantity so it really depends on what you care about seeing.
Linear:
Logarithmic:
If you’re interested in doing something like this, here is the script to set either of the two.
// Set to linear scale
chart1.control.yAxes[0].scaleType = dundas.controls.ScaleType.NUMERIC;
Set to logarithmic scale
chart1.control.yAxes[0].scaleType = dundas.controls.ScaleType.LOGARITHMIC;
1 Like
Haven’t really used Log scale as yet but will surely come handy for large data variations.
I have never used log in my dashboard but i know we can use it to normalize the value and usually used in the ML alogorithms
I didn’t came across any case where the log scales would apply, at least until now. Though, I perfectly understand the use of log scale.
Good info! Will try to remember when and if I use them. Thank you!
More options and tools to view/examine the data is always a good thing.
Never used it, but understand where it can be useful
Thanks will give it a go