When showing a table visualization with multiple measures across a single dimension (such as the month), it may be easier to compare the changes of the results month-over-month with a horizontal layout, vs. using a vertical layout.
While the default table view of Dundas BI is set to a vertical view, which is designed to help you compare the performance of measures against other measures (vs. the same measure over time), one can certainly use the transpose option to set the table with a horizontal view and have an easier comparison - especially across time.
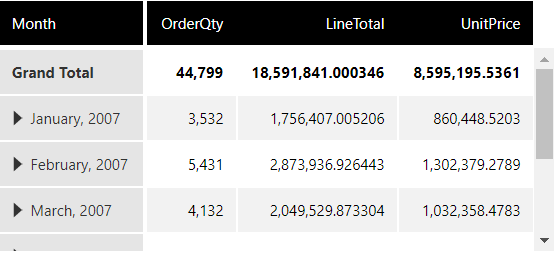
Default Table View:
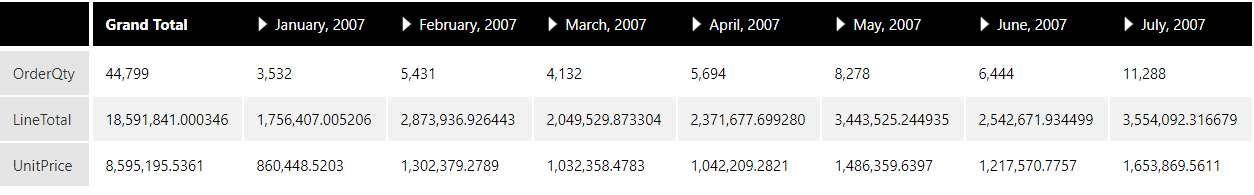
Transposed Table View:
For more details on how to transpose a table visualization, CLICK HERE