You can now drag a hierarchy onto the data analysis measures and get the count or distinct count for the hierarchy, against the existing hierarchy under the rows section. Drag a date dimension to the rows and then a product (or other) hierarchy to the measures section. Now you can see the count of each product under that specific time slice!
Tip 10 – Display Count & Distinct Count for Hierarchies
Take Hierarchy Count Measures to the next level by coupling it with filtering!
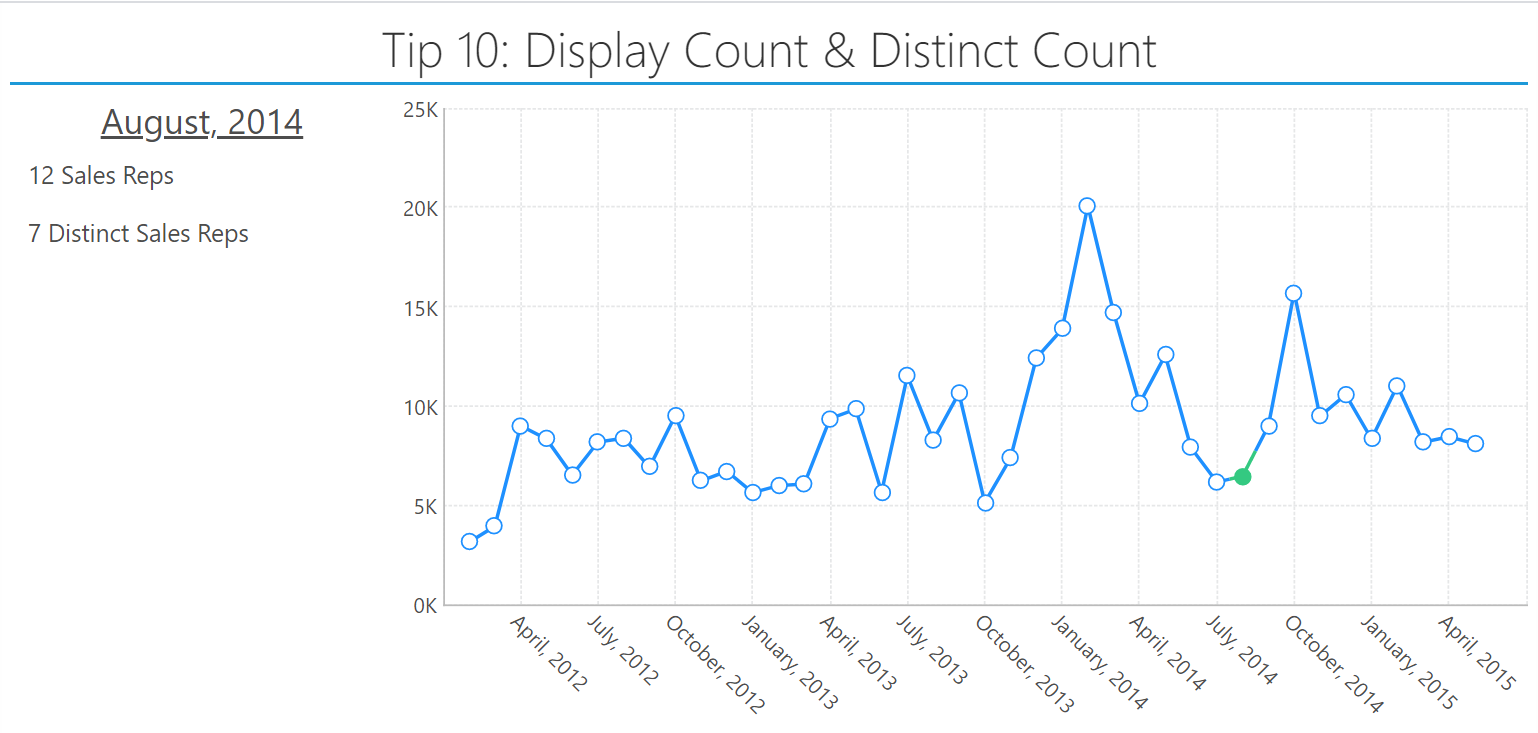
As you can see in the image above, I have a Line Chart showing me my sales figures for each month. To the left, I have three Data Labels. The first is showing me the date selected from the chart (shown in green on the chart), followed by the Hierarchy Count Measure for my sales reps using the Count aggregator, with the last showing the Distinct Count for my sales reps.
By setting up a Filter Interaction on the Line Chart, the labels will start to show me how many sales there are in a month (shown by the number of Sales Reps) and the number of distinct Sales Reps. So we can see that I had 12 sales by 7 Sales Reps. Since there are 10 sales reps in total, I can see that 3 didn’t have any sales in August, 2014.
Pretty neat.
1 Like