Hey Jack!
Below are the answers to your questions.
Can I create a template filter that can be re-used, that is in the same size and position (properties)?
With “template filter”, I assume you want to know if you can create a filter in your template and can then later on use this filter to connect to visualizations on the dashboard that you build using this template. If this is your use case, then unfortunately, you cannot create a filter in your template and then attach it to the visualizations later on.
However, you can create a template cell dedicated to the filter in your template and can later on add the filter to this particular template cell for all the dashboard that use this template cell. Something like this spot:
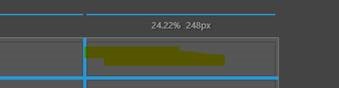
Now, when you use this template to create a dashboard you will just need to drag and drop your filter to this template cell and it will automatically adjust to this height and width thus maintaining consistency across the application.
How do I ensure these (measures with 0 value) are hidden when they are not relevant?
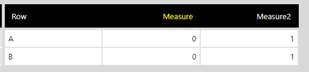
You can hide a measure using a small JavaScript code snippet. I have created a sample table visualization in which I have some measures out of which the value of one measure is all zero:
Now, in order to hide this measure you have a couple of options. One option is that to manipulate the measures into a single hierarchy/dimension that could be selected on columns, for example using the Unpivot transform of Dundas BI data cube. Then you could filter the column dimensions.
Second, you can also make use of the JavaScript code snippet to hide the measures from the current visualization based on certain conditions. We have a sample script that hides the measures from a table visualization. You can refer to this script.
I hope this answers your questions. Please let me know in case you have any queries in this.