STDEV calculated on a hierarchy which has a custom sorting

Hello all,

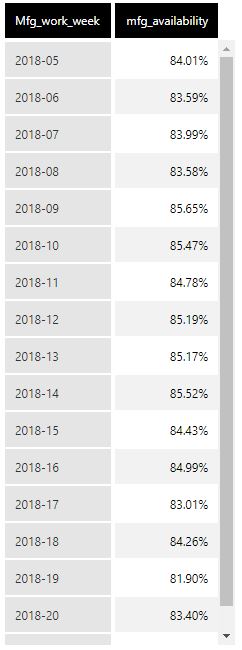
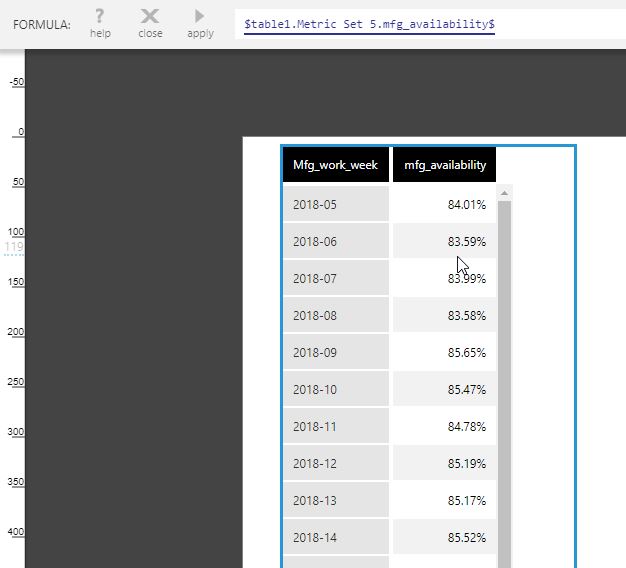
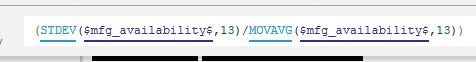
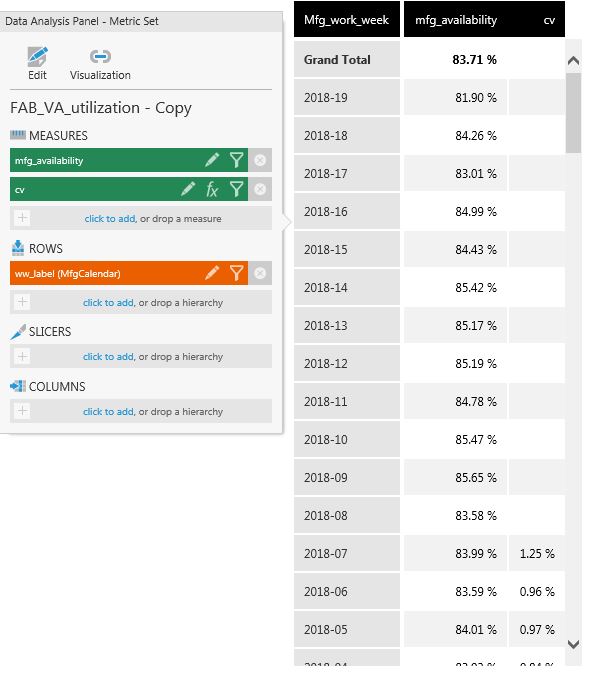
I' m tring to calculate the STDEV and the MOVAVG of a measure along a hierarchy MfgCalendar which is sorted in descending order on every level (as my customes want to see more recent data on top of the table)

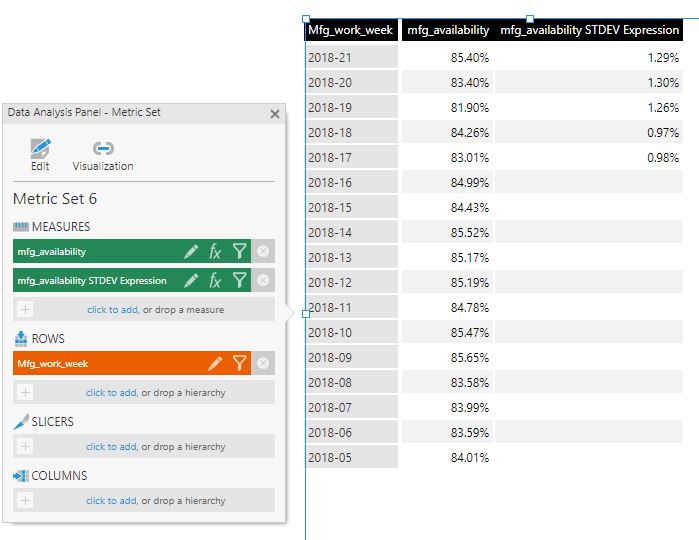
but I cannor get the values for the latest weeks

Image title

Any suggestion?

Thanks, Simona

Hi Simona,


The reason why you aren’t seeing values for the first 12 cells of your formula measure is because of the calculation you’re using. Standard Deviation and Moving Average contains a parameter where you can specify the number of time periods to use in the calculation. In your screenshot you have the values of both parameters set to 13 in each function. This means It will use the first 13 mfg_availability on the table for its calculations. In your screenshot, any day after 2018-07 has fewer than the 13 values needed to perform the calculations and is therefore the reason you see empty values. You could change the order of the Hierarchy to ascending, the first 12 cells would still be empty for the same reason as above but you will have values for the most recent dates.


You can also reference two articles from our support site that I've included below.


Hi Trevenn, thank you for your input.

It seems to me that order direction for the hierarchy is crucial as it states if calculation for Standard Deviation and/or Moving Avarage is performed with "past" or "future" values.

With ascending order, first 12 cells are empty but they are the oldest values; once 13 values are gathered calculatino starts.

With descending order, first 12 cells are empty but unfortunately they are the newest values and the logic of calculation is different.

Indeed the sort order is critical for the formula. What you can do in order to show the newest values at the top and still have the moving avg for those showing is to use a chart instead of a table. For example, you can re-visualize the table to a bar chart, change the moving avg series to be a point chart, adjust the marker height and change the market shape to rectangle add data points labels visualize something like this (note my moving avg has only 3 periods so I'm only missing 2 data points for those):

Image title


You can also try the following method to set the sort order of the Hierarchy to descending and have the Formula calculate from the bottom measure values.


  • Using your existing table, remove any formulas you may have so that the table just contains the Mfg_work_week Hierarchy and the mfg_availability Measure.


  • Create a Formula Visualization from the table and click on mfg_availbility to select it.

Image title

  • You should be presented with a new table. Remove one of the Measures on the new table, it doesn’t matter which one, they should show the same values. You can then add in the Formula Measure and use the remaining Measure for your calculation.


  • Now when you set the sort order of the Hierarchy to descending, the table should show the calculation for the most recent dates.


I hope this helps you get the desired visualization.

Very good input from both of you, thank you very much.

Will discuss with my customers for preferred solution.