Hello Octavian,
You can achieve this by using an Auto Color Rule, which will apply a color gradient (which is customizable), based on the weight of the value. You will have to apply this color rule property to each measure in your visualization. Here is a support article overviewing how to apply a color rule to your visualization.
Inside your visualizations property panel -> go into the measure -> under the Look header you can then add an auto color rule to your visualization.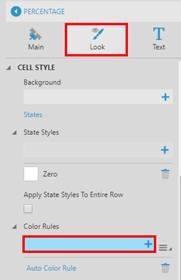
If you want to have your cells with the value of zero display with a white background, you will have to add a state style when the measure equals zero. You will have to add this state for each measure in your visualization. Here is a support article overviewing how to set up states for your visualization.
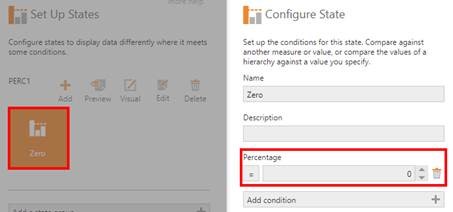
When you setup your state, you will want to change the color when the value equals the constant zero:
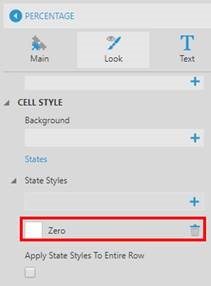
After you configure your state condition, you will have to modify the state style to change the color to white:
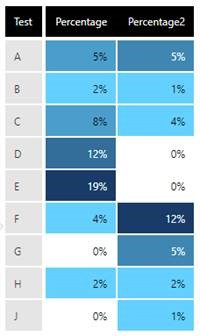
Result:
Please let me know if you have any questions about this.


