I have a bar chart with two metric sets.
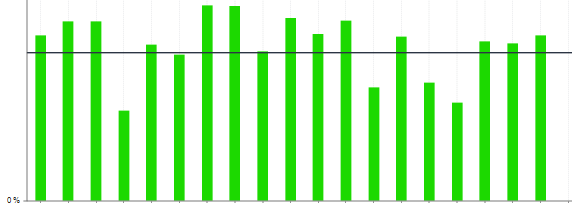
The bars are from the first metric set and the horizontal line is from the second. I am trying to set up states to change the colors of the bars if they are over or under the horizontal line.
When I go to the set up states area, I only see the option to select members of the original metric set, so I cannot select the formula which is making this bar.
I have tried making a formula in the original metric set by opening up the create formula area and click on the “avg line”. It creates the formula but is useless. This formula cannot be used even as bars in my chart.
Is there a workaround?