Script to maximize visualization view

HI,

Had a quick question - say you have a scenario where you have 4 components on your dashboard (ie 4 rectangles/squares: grid, chart, grid, chart). I want to be able to maximize across the entire screen each of these components. The way I have been doing it is via icon/image/button on each component where once it is clicked on I do the Hide/Show Layer functionality. I do not like this approach as in the ‘maximized view layer’ I am making a copy if the original grid/chart and passing the dame filter values. Iow, does anyone have some kind of JavaScript that I could use to maximize my original grid/chart size on a new layer/page. Thinking if my original grid/chart size is height=500, width = 250, top=10 I’d like to click on a button/image on this chart and once clicked on, maximize the size of it so the new, maximized grid/chart would b something like height=900 width = 500 top=10?

Not sure if I am going right about this issue but thought someone in here could have had the same/similar issue that they have come across?

Thank you in advance.

-Semir

Sure, you can use a script to do that. On the on click script, you can change the height/width as well as the top/left properties.
The only issue is that you probably will need to change the z indexes too, because whichever chart is maximised will need to be in front of all the others. This can also be done in the script.

Just thought i’d put the script into here that @david.glickman is talking about for anyone you might need them.

table1.height = ??;
table1.width = ??;
table1.left = ??;
table1.top = ??;

*replace table1 with the name of your control.

Also - be careful with View if you use a script like this to move and resize controls on a dashboard. Make sure your dashboard is Checked In or you are using Sandbox View as these sorts of changes via script are permanent otherwise. Changing these properties via script in View is the same as going over to the properties grid and making a change in Edit mode - the changes stick.

Thanks David and Jeff,

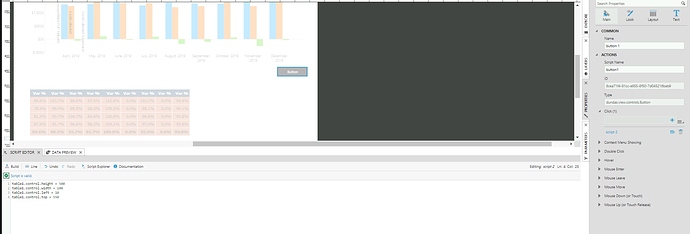
So I am testing this and I copied the code under Click area behind the button control (my control name is indeed table1, just fyi):

table1.control.height = 500;
table1.control.width = 100;
table1.control.left = 10;
table1.control.top = 550;

When I click on the button nothing happens (ie table does not move into a new position)(see the attached image).

My apologies, just getting a bit more into ‘scripting’ part in Dundas. Was not sure if I need to put more JavaScript code above?

@semir.taletovic - this is why i shouldn’t make forum posts before a significant amount of caffeine in the morning. I gave you the wrong scripts!!!

Here is the correct way to do this:

chart1.height = 500;
chart1.width = 100;
chart1.left = 10;
chart1.top = 550;

*i’ll also edit my original post so not to confuse anyone.

2 Likes

I do this with layers, click on the small front page version and it brings up the full version layer. But I like only having one copy of the metric set idea unless the large version has more in tool tip or larger text (hence my responsive text size request)

1 Like

Thanks guys!

Jeff’s code works like a charm :)…and yes James, that is exactly what I am trying to do with a single copy of a metric set…so far I have been making maximized copies of metric sets in a maximized layer (love the layering functionality in Dundas)…

One question unrelated to this - it is killing me in Dundas as I keep losing work or having to redo things (could be my error and not the tool’s workflow) - ok, so I typically make a metric set first then add it to my dashboard however, any changes after that, I keep making them DIRECTLY on the dashboard to that specific metric set. Well, these ‘formatting’ changes do not flow back to the metric set under Metric Sets folder when made DIRECTLY on the dashboard - so, is this the case for everyone? Iow, I am not following the proper workflow in Dundas or is there a way to refresh metric set under Metric Sets folder in a backward fashion (Dashboard canvas --> Metric Sets)?

Apologies in advance in case I was supposed to open a new topic.

Thank you!

-Semir

Hi @semir.taletovic - I’m personally not a fan of building metric sets and then adding them to dashboards as i find that what i build always ends up being tweaked in the long run. Pre-building metric sets is great for reuse but I find that reuse doesn’t really happen very often in practice. Why not save the headache and just build metric sets right on the dashboard on demand?

@semir.taletovic
When you make a Metric Set then Add it to the Dashboard it is a sudo copy with some items like what Attributes it has still firmly linked to the original but any how it looks like what size text has its own setting and will not update the original.
The biggest clue is if you have the original checked in and make a change on the dashboard copy and it lets you with out checking out the original metric set then you are only changing the copy.
This is so you can have a small version and big version and both will have a different look but the base will be the same, you can even change colors I think.

1 Like