Hello,
I am creating a static quadrant by using lines from the Components section. But can we have a dynamic quadrants(using baselines) in Dundas.
Regards,
Sam
Hello,
I am creating a static quadrant by using lines from the Components section. But can we have a dynamic quadrants(using baselines) in Dundas.
Regards,
Sam
Dundas BI 4 introduced the ability to indicate where the axis of a chart should cross.
You can find information about that and other axis configurations in the article on using chart properties.
Hope that helps!
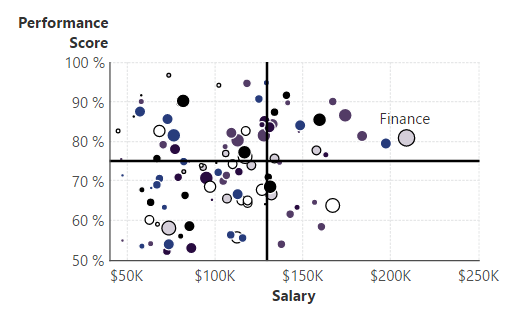
Another option to achieve this would be by adding either existing measures or formula measures to your existing bubble chart. Set those 2 additional measures to use line charts (if those are formulas you can do so when creating the formulas, otherwise you can configure those from the chart properties under the series or by right click and revisualizing those). Then under under the data analyis panel, you can open the visualization menu and set the one measure to be on the Horizontal Axis and the other on the Vertical Axis. This will allow you to get a chart like this: