To clarify what I need - I’m still not 100% sure what the best approach is.
I need to calculate a measure - let’s call it ‘brand awareness’ as a percentrank. So each of the 300 brands has a ‘brand awareness’ score, and each of the brands will have a percentrank for that score out of all the brands. Take all 300 brands’ ‘brand awareness’ scores, and create a new measure for each of them which is the ‘brand awareness percentrank’ calculated from their score.
Now, going to the dashboard - I need to have a chart which only shows one or two of the brands. I need to show the brands that the user has chosen - let’s say ‘footwear brands’, but instead of showing the actual ‘brand awareness score’, the scores shown for those brands need to be the ‘brand awareness percentrank’ score for those brands, calculated out of all 300.
For that, I think that doing it at the cube level will work. Calculate a new ‘brand awareness percentrank’ measure which is all the scores for all the brands in the cube out of all the other brands, and then filter on the dashboard level to only show the values for the brands that I want.
I have the scores at a respondent level - meaning I need to aggregate them first. I guess I can use an aggregation transform to add up the individual answers to make a score and then feed that into the percentrank.
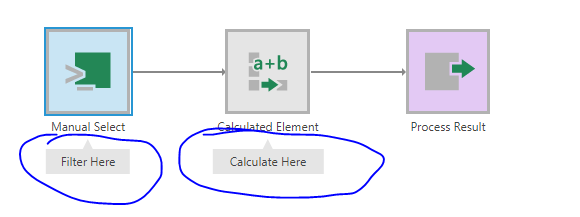
Next issue is, I may need to show the ‘brand awareness’ score for only the people in London. I will need to have a region filter which will filter all the scores for all the brands before it feeds into the percentrank calculation. For that I think Jeff’s solution will work - connect the filter in the datacube before the percentrank calculation. This can be public and so accessible to the viewer on the dashboard. This filter will change all the percentrank numbers for all the brands, and then my dashboard filter will only show the values for the brands that I need.
Make sense?
 so yes i get it.