Hi Team ,
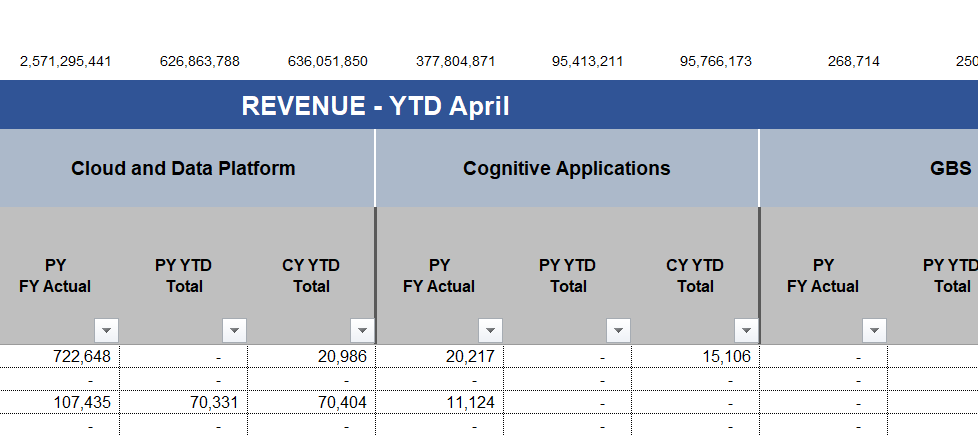
I need to show the total in table visulisation for few columns at the top. I know i can create formula visulisation but how i can arrange it exactly at the top of the table and will it show fine in the export? is there any alternative?
Hi Team ,
I need to show the total in table visulisation for few columns at the top. I know i can create formula visulisation but how i can arrange it exactly at the top of the table and will it show fine in the export? is there any alternative?
Can anyone please help?
Hi Mitsu,
You can make use of the following components to get the grand total (Formula viz.) on top of the table:

If you have the table and formula viz in the dashboard you can export them in Excel by using Share-> Export option. Since the grand total is in a formula viz it will be exported into a separate sheet. You can make use of macro to manipulate the sheet rows.
You can read more about table visualizations at https://www.dundas.com/support/learning/documentation/data-visualizations/using-a-table-visualization For template grid you can view the video at https://www.dundas.com/support/videos/template-grid
Hi ,
The question is how can we use macros at dundas level so that it generates the manipulated sheets automatically ? Please provide some guidance , or documentation to refer.@kv1