https://www.dundas.com/support/learning/videos-tutorials/designing-views/working-with-formulas
I know you can make a formula for the static line, and I am sure you can work one out for the dynamic one, there might be some scripting to it i not come across a need for something like that yet.
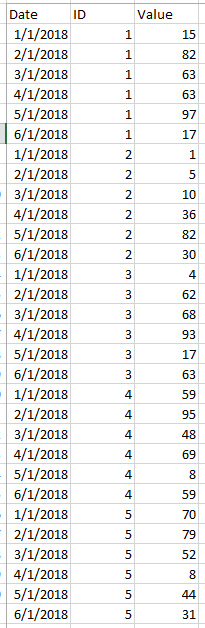
Wait so the two static lines are the values of ID 1 and 2 repsectivly. If i was doing this I would make two metric sets one for each ID you want and have them always filtered to those ID's.
Then a third one that you could filter to any one you want.
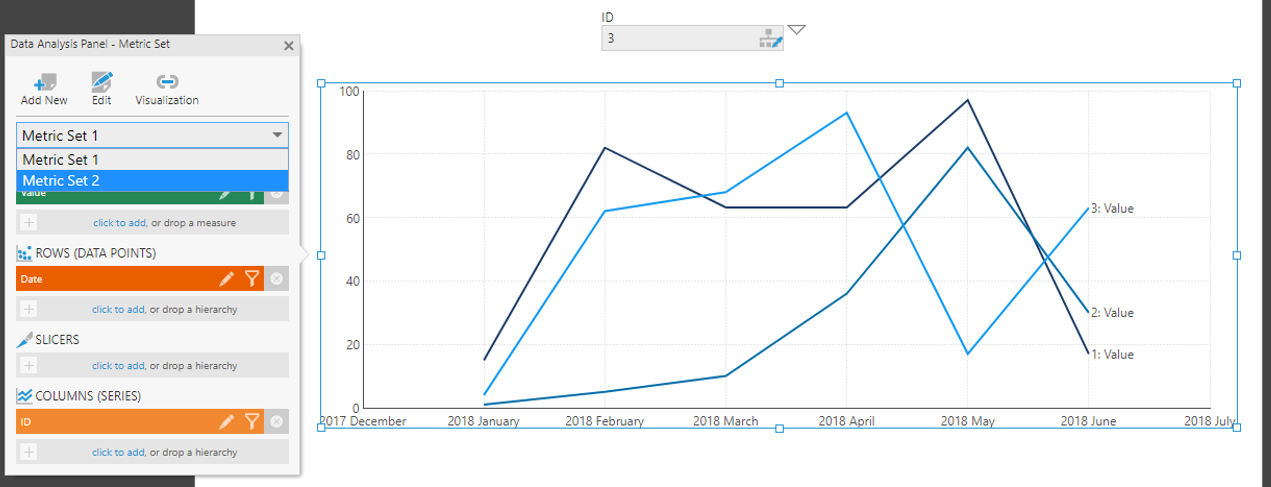
Then you just add them alltogether into one graph on the dashboard. (looking for example on support site on how to do that......) cant find it (i know it is there, I have done this).
Add the first one then drag the other one on top of it, then repeate for third one (correct me if i am wrong) then you should be able to set up a filter that only filters the one you want to be dynamic.