Limit number of values to show on the Bottom Axis

I’m hoping this is a simple question but I can’t find the answer anywhere else so figured I’d try in here before going to support.

All I’m trying to do is limit the number of labels shown on the bottom axis.

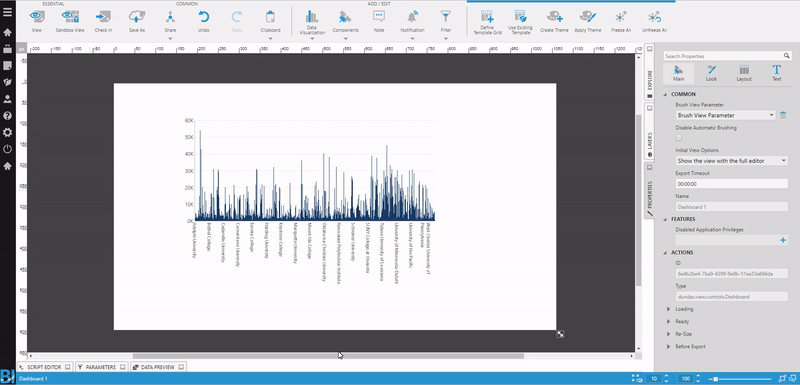
In my scenario the bottom axis is a Date/Time scale type and I want to limit it to showing no more than 36 days/months (chart view parameter depth level is changed based on filtered selection, allowing it to adjust between a month or day breakdown for the labels being displayed)
Is there a way to limit the number of labels to a maximum?

Thank you!

If you mean that you want to set the maximum number of items allowed on the axis (not just labels but data points too) then you can do this in the zooming options.

Go to ‘Horizontal zooming’ near the bottom of the ‘Main’ tab of the chart properties and you can set the ‘Maximum number of categories’ to whatever you want. If there are more categories there, it will put a scroll bar unless you uncheck ‘scroll bar visible’

Hope that’s what you’re looking for - if you just want to hide the labels but leave the data then this won’t help.

2 Likes

Exactly what I was looking for. Not sure how/why I missed it but thank you very much David!

It is well hidden, as an axis setting inside the zooming section. I had to be shown it by Dundas support
Maybe someone at Dundas can look into changing the UI?

Just any case anyone else is having trouble finding this, here is a quick video.

3 Likes