Technically, I’m a BI Solution Engineer here at Dundas Data Visualization but I’m famously known to provide unconditional support to DBI users with their analytics explorations.
I started my career as a Software Developer in an IT Consulting firm and then went on to assume the role of a Technical Analyst before pursuing my master’s in Data Analytics from Eindhoven University of Technology, Netherlands and Université Nice Sophia Antipolis, France. It was an exchange program that involved a year in each of the universities. I remember it as one of the best phases of my life! I don’t remember studying as much as travelling during my time in Europe. Eventually, my love for exploring places brought me to Canada.
I am lover of art and design. I see data visualization as the form of art one paints with numbers and designs. It keeps me hooked for hours! Also because the goal can be something new every time and it’s in the hands of the visualizer how to chart a really interesting story. Perhaps it’s this fascinating intersection of data and design that drew me to Dundas Data Visualization.
My hottest take on the emerging trends in the BI & Analytics industry is that VR/AR enabled visualization would take over the world. Data visualization of complex, huge, and multivariate data will enable people to understand what’s going on inside without having to constantly project and translate between dimensions. Expensive and not useful for all domain but might be great in future to analyze and communicate real-time dense clusters/network-based structures. Also, might be great for educational purpose. I have experience seeing one dealing with social network analysis where the viewer could simply drag to add/remove cluster components and view the changes – it seemed pretty cool!
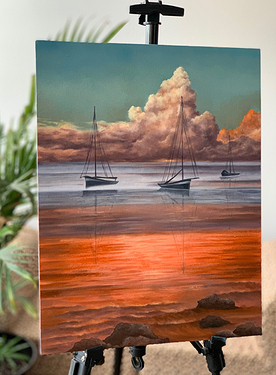
@tejas.shah likes these introductions to include some hobbies and passions… mine is painting (someday will switch to it full-time). I’ll leave y’all with some of my artwork. Cheers!


 Loved them!
