How to create -ve axis from-100% to 100% in dundas?
How to show -ve axis values in dundas?
Hi Jeff,
Thanks i can see its working now, but how can i make it data driven i.e. when -ve values are not there , the -ve axis should not be shown
Hi Mitsu,
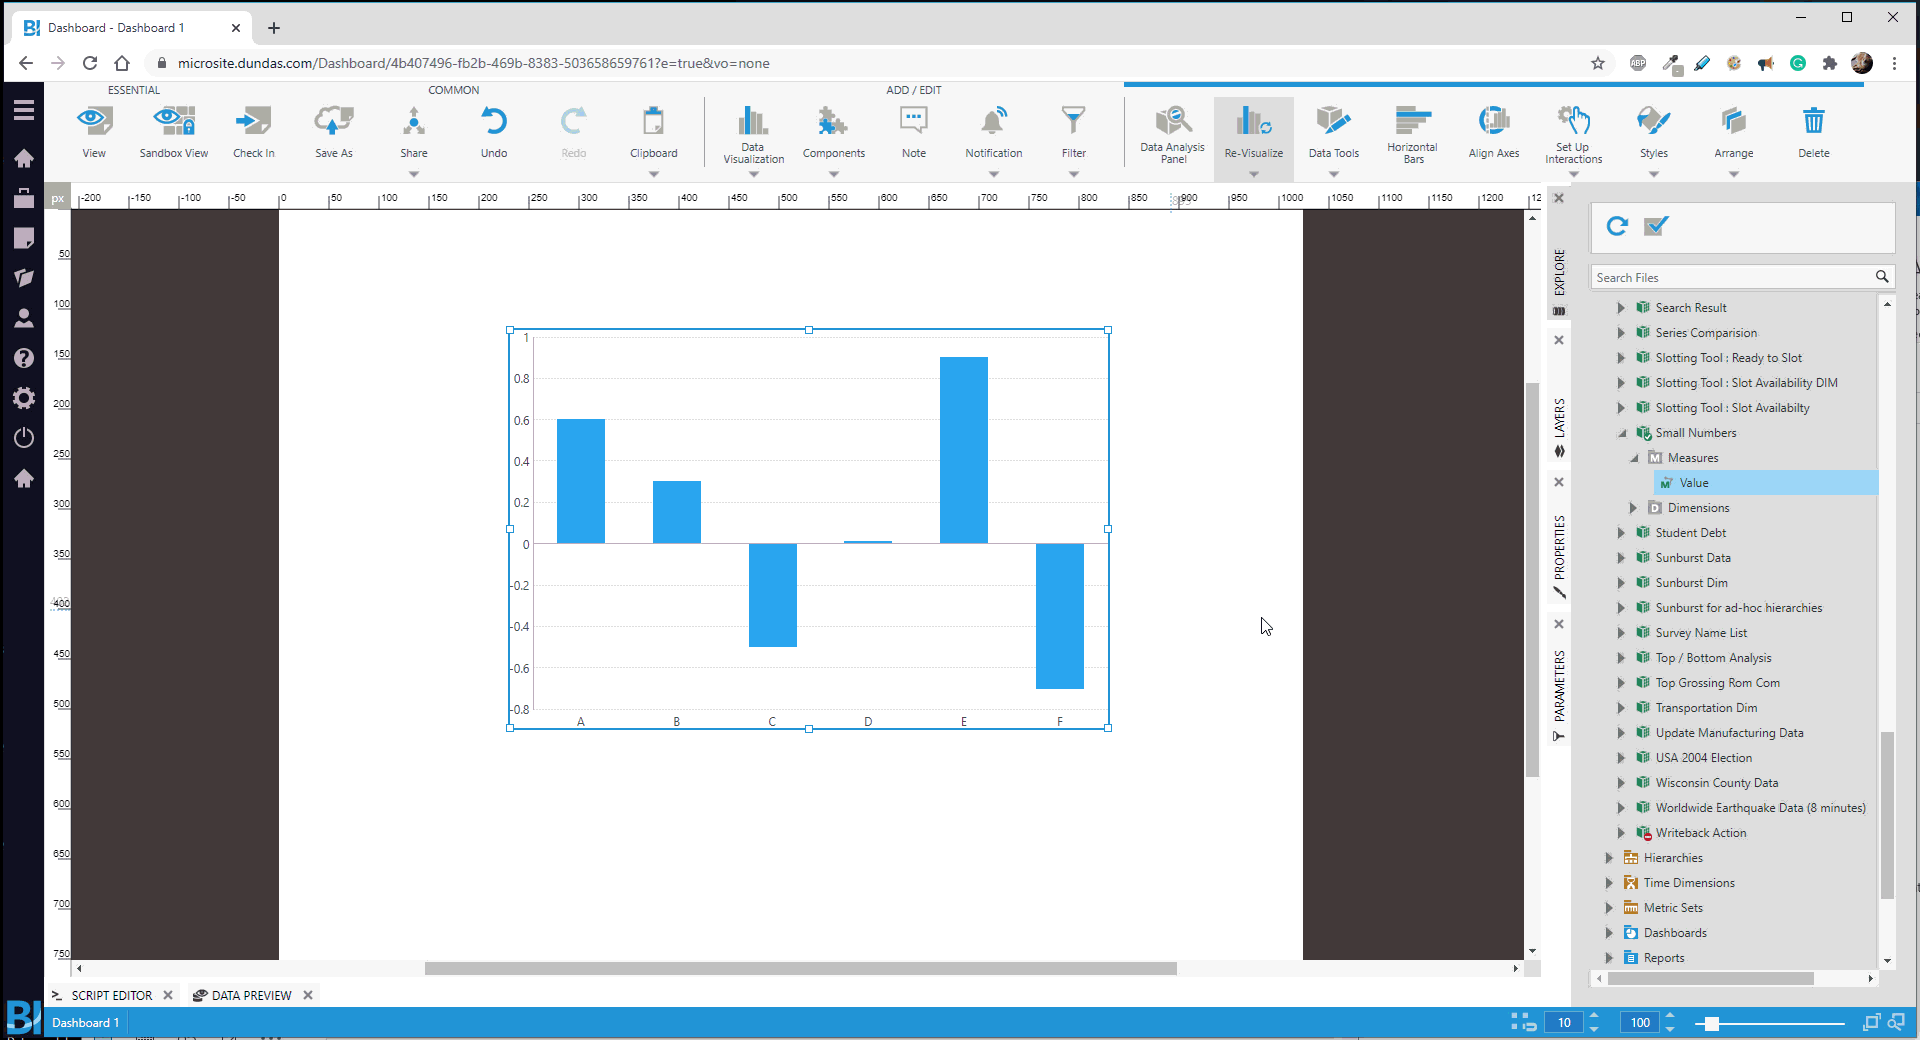
The chart is automatically data-driven by virtue of the Custom Minimum and Maximum properties not being set. As the data changes, the scale will automatically change to something appropriate based on the data in the chart. If you’re finding that you don’t like the algorithm used to determine the scale, you can always write your own script that will do it differently by looking at the data and changing the Custom Minimum / Maximum as i showed you. (programmatically)
Setting the Custom Minimum and Maximum is also helpful when you know that your data is always expected to fall into a certain range so that you can control the window being displayed.