How to show survey data by column in table without duplicates

So, I got my survey data set up according to best practices I’m familiar with: Getting Survey Data “Just So” | Data Revelations

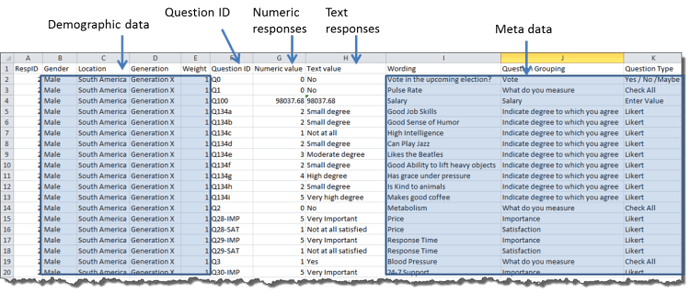
Screenshot from that post (not my data):

This way you can easily do calculations across questions, not have to create case statements for all the metadata, etc.

For part of a dashboard, I’m creating a table metric set. I expected when I moved a dimension to columns, for instance question wording, it would only show the data that fell under that particular question under that column. However, it did not show anything at all:

When I revisualized as a flat table, that issue was fixed, but instead, the columns both showed the same response!

How can I get the responses for each question to show in columns without changing the data cube?

Thanks!

ETA: For reference, this is how it looks with Question Label a part of rows where you can see what questions the text response actually belongs to:
image

Hi Lindsey,

This seems related to the other post I just replied to. The original table layout is representing the structure of the data: if Text Response (and Respondent) is on Rows in the Data Analysis Panel, what this means is you will get a separate row for every different Text Response value (for every Respondent). This doesn’t change when you move another dimension to Columns, and this isn’t enough to turn your multiple rows of Text Responses into a single row of responses fitted under each corresponding column from your other dimension such as Wording (assuming there is only one Response per Wording, otherwise selecting the data this way doesn’t seem right). Measures can be displayed this way at each intersection of rows and columns, which are numeric data only so it can be grouped and aggregated.

If there is a known set of Wordings and one Response per Wording, for example, what we could recommend here is to pivot the data from separate rows into separate columns, and then add each of those columns to the table instead.