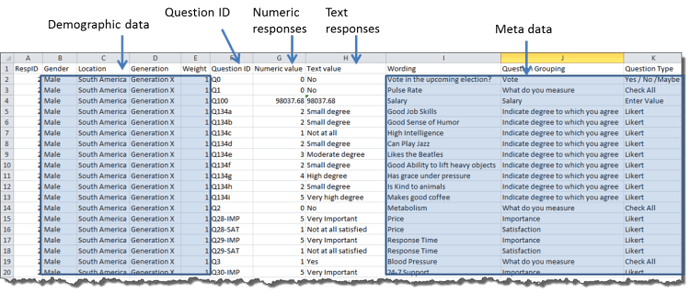
So, I got my survey data set up according to best practices I’m familiar with: Getting Survey Data “Just So” | Data Revelations
Screenshot from that post (not my data):
This way you can easily do calculations across questions, not have to create case statements for all the metadata, etc.
For part of a dashboard, I’m creating a table metric set. I expected when I moved a dimension to columns, for instance question wording, it would only show the data that fell under that particular question under that column. However, it did not show anything at all:
When I revisualized as a flat table, that issue was fixed, but instead, the columns both showed the same response!
How can I get the responses for each question to show in columns without changing the data cube?
Thanks!
ETA: For reference, this is how it looks with Question Label a part of rows where you can see what questions the text response actually belongs to:


