Hi Carolina,
since you want to show the hours in a datalabel which make your mission is easy to be done using JS.
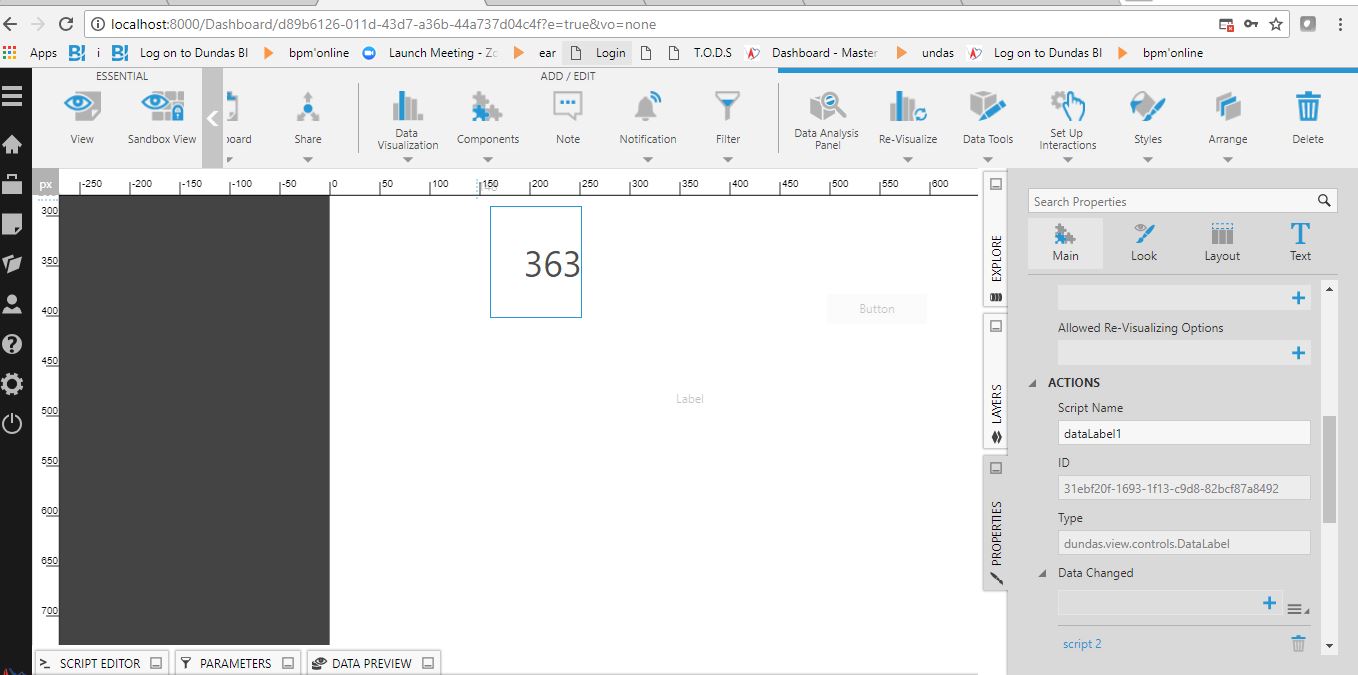
To do it, drag a label to the dashboard. Then on the dataLabel you have that shows the average hours ---> create a script under "Data Changed" interaction and paste the following script:
//********************************
var totalSeconds = dataLabel1._metricSetBindings[0].dataResult.cellset.cells[0][0].value*60*60;
if (totalSeconds == 0)
{
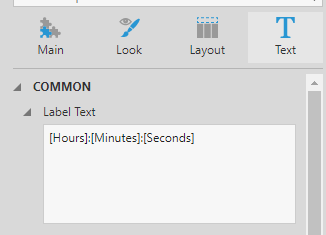
label1.labelText=hours+":"+minutes+":"+seconds;
}
else
{
hours = Math.floor(totalSeconds / 3600).toString();
totalSeconds %= 3600;
minutes = Math.floor(totalSeconds / 60).toString();
seconds = (totalSeconds % 60).toString();
if (hours.length == 1)
hours = '0'+hours;
if (minutes.length == 1)
minutes = '0'+minutes;
if (seconds.length == 1)
seconds = '0'+seconds;
label1.labelText=hours+":"+minutes+":"+seconds;
}
//*************************
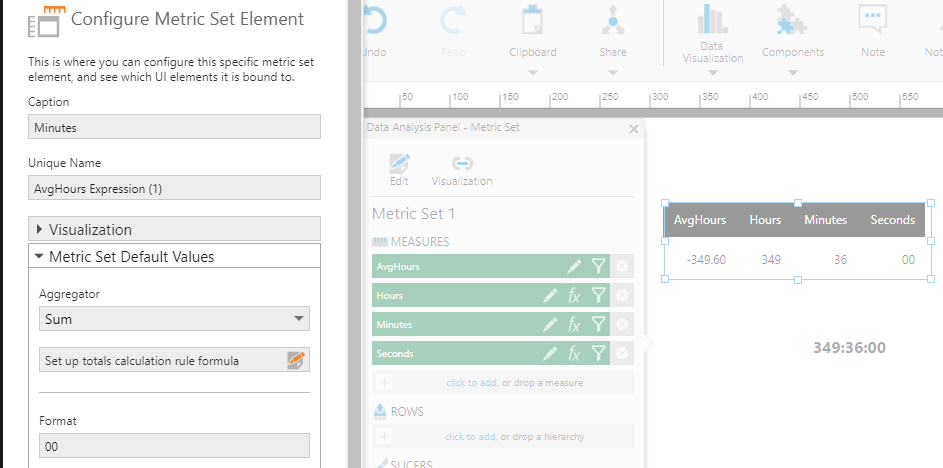
Supposing your datalabel is named as dataLabel1 and the label is named as label1.
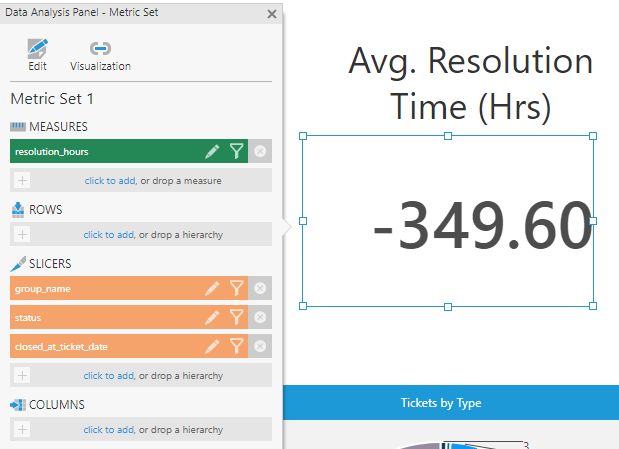
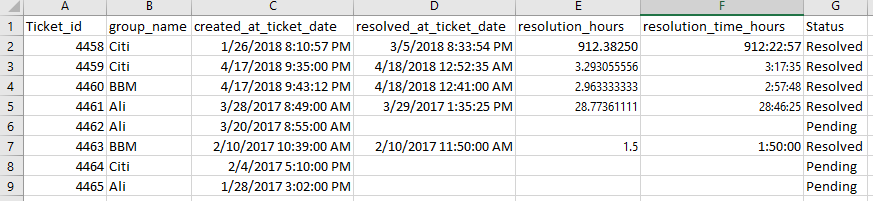
But I am surprised in your example why the average hours is shown in minus. I beleive it must have positive value.
Then you can drag the datalabel outside the canvas or making its opacity to be 0. in other words, no need to make it visible on the dashboard.