Hi, I’m trying to create a bar chart in a dashboard that highlights a subset of my data via a picklist in the dashboard. For example, I would like to highlight (with color and a data label) the data related to a single client, where the chart shows data for all clients, so I can see where they stand personally against other clients in the full data set. Right now, I am setting up states based on a column I added that has a 1 for the data points I want to highlight and a 0 for ones I don’t want to highlight. However, I would like to be able to choose which data points to highlight inside of my dashboard rather than updating this column on the back end every time I want to update this chart. Is there a way to set up a state from a picklist inside of a dashboard, or is there a way to highlight certain data points (via color and data label) without using states?
How to Highlight Member of Picklist in Bar Chart
Hi Kali,
There should be a lot of options:
-
The dashboard’s “brush view parameter” allows you to pass data to it through an interaction to highlight data points. (If you do this, select the Disable Automatic Brushing property of the dashboard.) This is often done with an interaction set up on another visualization, which in your case could be a table visualization for example that lists the clients. If you set up a filter interaction on it and set up its parameter mappings to pass the clicked value to the Brush View Parameter, be sure the client values are also added in the chart’s metric set, and the chart’s data points with matching client values will be highlighted.
-
If you want to use a regular hierarchy value filter above instead of a table, this is also possible but the hierarchy filter also needs to be hooked up to a hierarchy in some metric set to filter it, even if it’s just a Data Label visualization that displays the client value. Then you could add a filter interaction to the filter with a parameter mapping that passes a value from the filter’s view parameter to the Brush View Parameter.
-
Since you’ve already come up with a column containing 0s and 1s and are using it for states, there are ways to change those 0s and 1s based on a parameter you can hook up to a filter on the dashboard, but I’m not sure where this column comes from. You can fairly easily let someone type in a text value or set up a dropdown list of predefined text items if you add a formula measure that compares against a parameter:
if ($Client$.Caption == $Parameter$) return 1; else return 0;You can just make up the name “$Parameter$” to create a parameter placeholder, then click on $Parameter$ and change the value type to String, and connect that to a filter or view parameter. If the 0s and 1s come from a data cube right now, there are ways to create parameters there that you can connect to a filter on the dashboard, for example if it’s a manual query or stored procedure. That parameter can easily pass in a string from the dashboard, or if you want to use a hierarchy value filter on the dashboard a bridge parameter can convert the selected hierarchy member into a string.
This post may already be too long. Let us know if one of these (or none of these) work for you and you’d like more details.
Hi Jamie,
Thanks so much for your detailed response. We’re attempting suggestion #3, and I believe we’re close to implementing but not quite there.
I’m not seeing a way to connect the placeholder parameter to an existing filter or view parameter that is being used for other visualizations. To connect the placeholder parameter in my formula measure to a view parameter as you suggested, I had to disconnect the view parameter from the other charts (as per the instructions for parameter placeholders), which caused the filter to null out in the sandbox view. I could not reconnect the view parameter to those visuals afterwards as I had hoped.
My calculated measure is showing 0 for all data points because it is checking against this empty list, so I do think we’re halfway to the solution at least.
Ideally, I would like one filter on the dashboard that will filter a table (showing only the selected items), filter a chart (again showing only the selection), and highlight the selected buildings in a second chart. Is this possible with this method? Thank you so much for all your help!
Hi Kali,
I think the best fit for what you described at the end is probably #2. If you already have a filter set up to actually filter a table and a chart, you can add a filter interaction to that filter to also pass those values to the brush view parameter to highlight them in a second chart. (This means you’re probably not using the automatic brushing behavior, which is why you should probably disable this in the dashboard’s properties.)
A string type parameter can work directly with a textbox filter or the interactions you can set up on controls like on a drop down list, but you won’t be able to hook up a hierarchy filter to it. It would be possible to use script in the hierarchy filter’s Value Changed actions to take that filter’s selected member(s) and pass a string to the string parameter value, but that would be easiest if you could only select one value. Something like this:
var string = this.control.hierarchyExplorer.getSelectedMembers().map(function (member) { return member.caption; }).join(",");
var stringViewParameter = this.parentView.control.getViewParameterByName("viewParameter1");
if (stringViewParameter) {
  stringViewParameter.parameterValue.clearTokens();
  stringViewParameter.parameterValue.value = string;
  stringViewParameter.invalidateParameterValueLastModifiedTime();
  stringViewParameter.refreshAllAdapters();
}
You should be able to do this without script though unless you prefer to do it that way.
Hi Jamie,
For the specific dashboard I am working with, there is no “Brush View Parameter” listed under the parameters. Have you encountered that error before? I went to a clean dashboard and I can see that the Brush View Parameter was automatically generated, but it does not appear on my dashboard. I uploaded a photo of my view here.
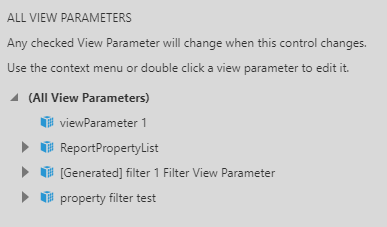
Hi Kali,
Every dashboard starts out with one, but there is nothing special about it other than being set as the Brush View Parameter in the dashboard’s properties, and you’re allowed to delete it. You can create a new view parameter and select it as the new brush view parameter in the dashboard’s properties for it to work the same way.