I am using the 'Top / Bottom' function in my metric set for displaying the top 5 members of a dimension. So if the displayed dimension for that measure is 'fruit', how could I determine the rank position/number for the member 'Apple' that I know shows up in the top 5, then display in a data object, Apple: 5th
How to find the rank position of a dimension member
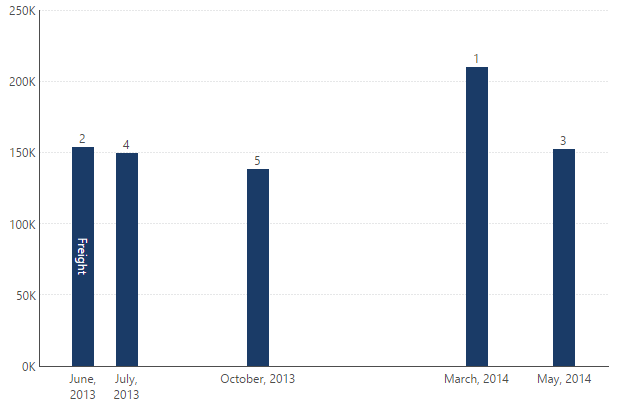
You will have to add two measures to the metric set, one with a constant “1” and another with a cumulative total formula CMLTOTAL($Constant(1)$).
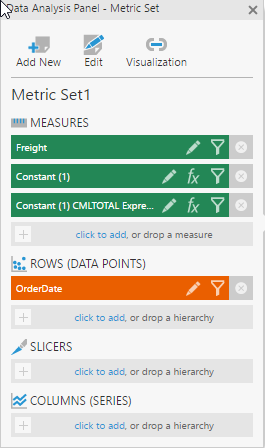
This will give you the rank order. You can of course hide the two additional formula by setting the series visibility, and still be able to use placeholder [Constant (1) CMLTOTAL Expression] at places such as data point label. This will give you the ranking:
Alternatively, you could use a Rank transform on the data cube. This also gives you an additional way to display the top 5 by filtering by the resulting rank.
Thanks Liang, the cmtotal method is what I was looking for. I was not able to figure out a way to get the Rank transform to work with aggregated and formula based measures.
But now I am struggling to show a specific member value in a data label object. I would like to show a data label that always shows what the rank value for 'Apples' is. I can create the data label object and it shows me the dimension item at rank 1 ie 'Bananas' and not any others. I would like to configure it to always show 'Apples' and it's corresponding value, be it '3' or '12'. I was hoping to accomplish this without script, but I do not see a way to do it.
Hi Doug, displaying a specific hierarchy member on a data label is possible, however since the data label can only display one row of data, the corresponding ranking position for this hierarchy member will always be 1. If you wish to display the actual ranking for "Apple", you would need to add an aggregate transform followed by a rank transform in your data cube, or write a script. I will follow up with you to see why you are having issues setting this up.
Hello Liang,
Thanks for the guidance, I am struggling to get the cmltotal to work in the context I need it. The table below illustrates what I am trying to achieve. I will then likely use script to extract the different rank values. Hopefully, I am over thinking this and not seeing the simple solution.

If you want to acheive that exact table, you will have to use the Rank transform on the data cube, as Liang sugested. Doing the ranking on the data cube will also make it possible to extract the value without script.
The alternative on the dashboard level would be to break it up into three separate tables, one for Cart, one for Market, and one for Grocery. Each of them will have to be sorted descending by the metric fx 1 column for cmltotal to give you the correct result.
Thanks for the response Elia, I have looked at the rank transform, but I am not sure how I would configure it to be used for a formula based metric that is a ratio of two separate measures that have also been aggregated over 4 time periods using the momentum formula. Is that even possible for the rank transform?
I will try the individual tables and then see if I can use a formula visualization to extract the value.
You will likely have to construct a very complex data cube that does all the aggregations and calculations before feeding the data into the rank transform, or write a custom query that does it for you. However, since I am not familiar with everything you have going on there, I cannot say for sure.
Give the individual tables a try. If that doesn't work for you, I think our Professional Services team should be able to help you design a better solution.