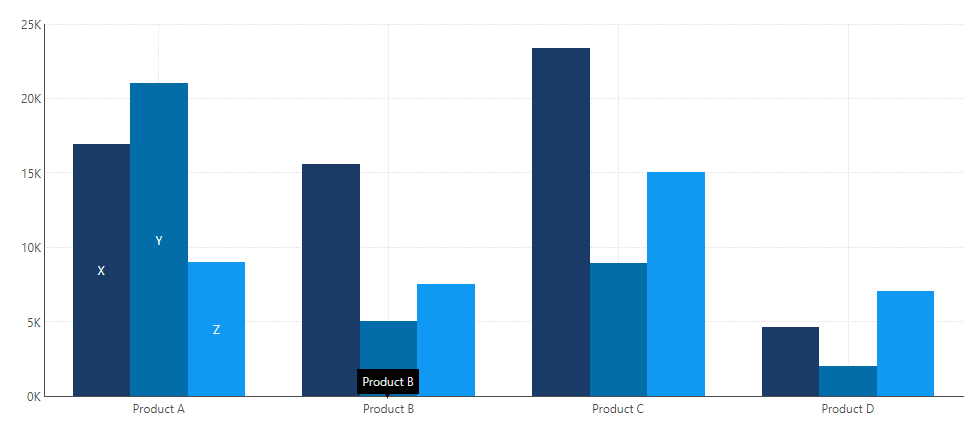
Say that there are two data fields: Product Code and Product Full Name. Is there any way we can use Product Code as the axis label, and Product Full Name as the axis label’s tooltip? It seems that by default axis label’s tooltip is exactly the same as the label itself…
How to change the tooltip for Bar Chart's axis label?
You can change the visualization using Data Analysis Panel and properties.
https://www.dundas.com/Support/learning/documentation/analyze-data/formatting-text
Various text and tooltip properties of data visualizations accept placeholder keywords that resolve into corresponding measure or hierarchy values for each data point, row, column or cell. They are often prepopulated for displaying the data assigned from the Data Analysis Panel’s Visualization tab, but you can optionally set this property yourself rather than assign data to it from the Data Analysis Panel. When you click into one of these properties in the Properties window, a popup will appear with suggestions for the relevant keywords.
Thanks for replying, Jeff. There seems to be no property for setting up axis label’s tooltip. Note that I am trying to use a different data filed as the tooltip, not formatting the axis label.
Hi Jian,
Start by going to the Data Analysis Panel and click on Visualization at the top. You will see a list with all of the series you have created. Click on “More…” and you will see an option to drop fields into the tooltip.

