How to Calculate a Measure Based on Subset of Available Data

Hello,

I have a data cube which contains three different metrics for 10 different users. Seven of the 10 users are part of the same group and I’m wanting to evaluate their performance against one another and exclude the other three users that I’m not interested in. I’ve built a metric set that presents the metrics for my seven users of interest in a table and includes a calculated measure that’s based on the their total production. It works as intended as long as I have it filtered for the seven users that I’m interested in reporting on but I want to take it a step further and be able to have the calculated measure calculate the groups total production even when they’re not all filtered for.

I would appreciate any help/direction on how to achieve this.

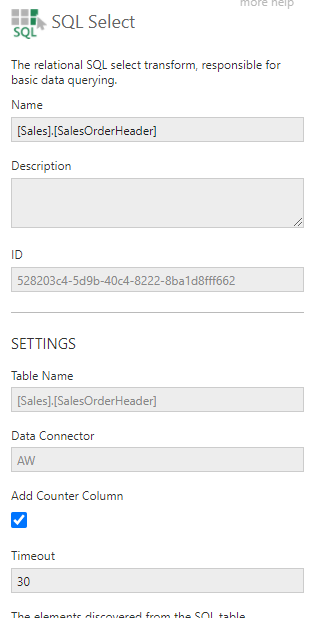
You’re definitely on the right track with the calculated element. I’m assuming you have hardcoded a 7 in your calculated element to represent the denominator (the 7 users). Instead, what you’ll want to do is add a counter column via the SQL select, then use something like SUM($count$) (or whatever the counter measure is named, in your case) as the denominator.

Thanks for your help, Christian.

Is there a way to calculate the numerator as the Grand Total of all seven users even when they are not filtered for and do not appear as rows in the chart?

Hi Brian,

There are different ways you should be able to do this depending on the details of your scenario. My guess is that one of these should work:

If some of your users are being filtered out by something other than the User values themselves, and you can place that data on Slicers on the metric set, you can use a slicer comparison to get the value for the other filter values (for all 7 users).

A formula metric set is another way to combine the two sets of data. Your calculated measure value looks the same in every row, so if you have your original metric set on a dashboard alongside a separate metric set that just contains your calculated value by itself in one row, you can create a formula visualization with a formula that combines this with the original metric set such as $table1.Metric Set 1.Total$ + $table2.Metric Set 2.Calculated Measure$. (If you don’t actually want any formula result like this you can then remove it from the new metric set leaving the rest of the data combined.) To include other measures, you can either refer to them in the original formula or drag them onto the new metric set.