We are back with another success story that we can’t wait for you to sink your teeth into!
Two in one month, Jordan? I know! Our customers are just so successful, I can barely keep up with them.
This is the story of how Curaçao Ports Authority – and their phenomenal Business Intelligence team, spearheaded by @andy.gomes and Urvin Inocente – established a data-driven culture and slashed reporting cycles from monthly to real-time.
After automating nearly every process, Curaçao Ports Authority (CPA) was in a position to leverage the massive volumes of data it had acquired. Dundas BI was the catalyst for taking and adding clarity to that data, and empowering CPA to embrace a data-driven culture. As a result, it’s been able to aggregate and analyze enterprise-level data, slash its reporting cycles, and empower its employees to perform their jobs with higher levels of precision.
–
Andy Gomes is an IT Engineer at Curaçao Ports Authority (who, as a new grad, led the charge for a Business Intelligence implementation)
Urvin Inocente is the IT Manger at Curaçao Ports Authority
–
After checking out the success story, feel free to leave any comments or questions for Andy and Urvin below!
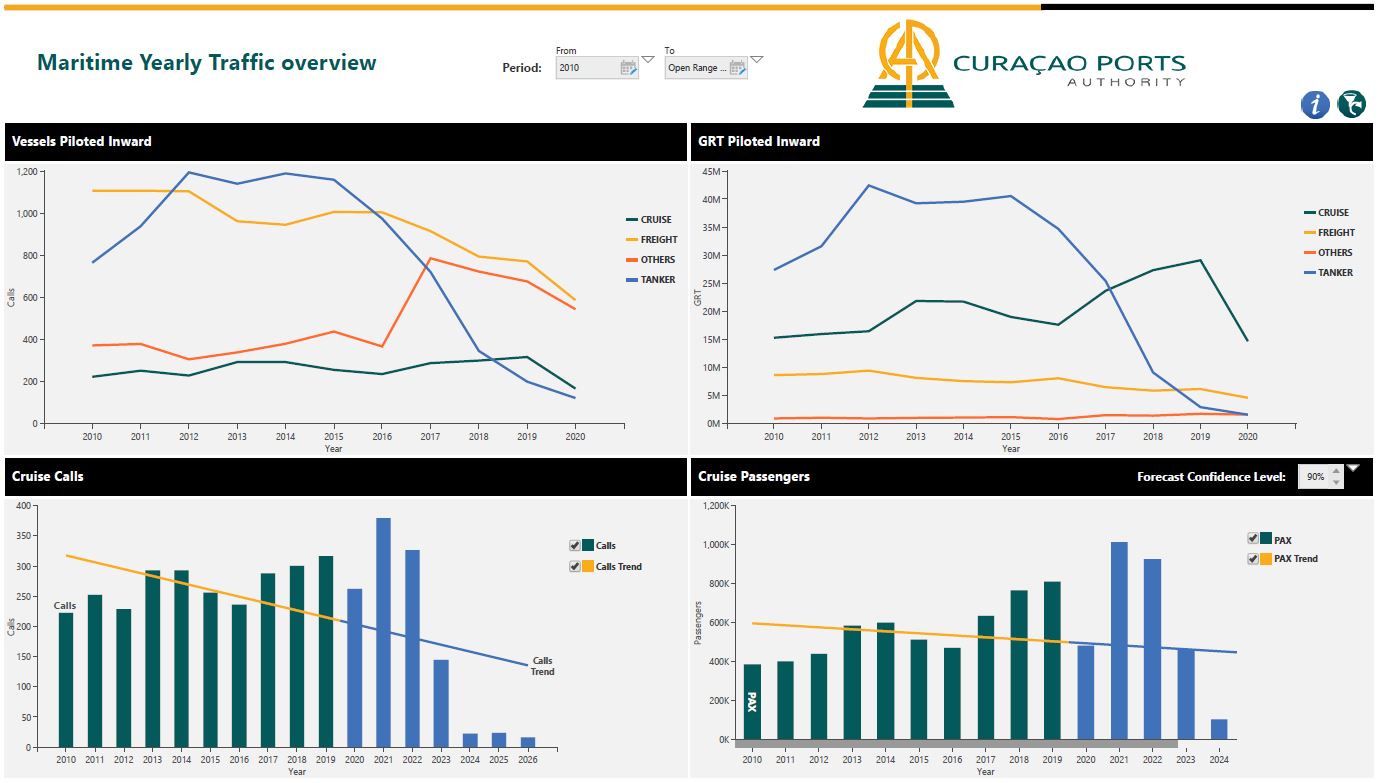
And take a look at these screen shots of Curaçao Ports Authority’s magnificent solution - breath-taking!