I have a line graph, pretty basic, displaying percentages, guaranteed to be between 0 and 100.
The actual data will only cover a subset of this (eg. from 10% to 40%) but I want the legend on the left to have a marker from 0 to 100, not only from 10 to 40 in my example.
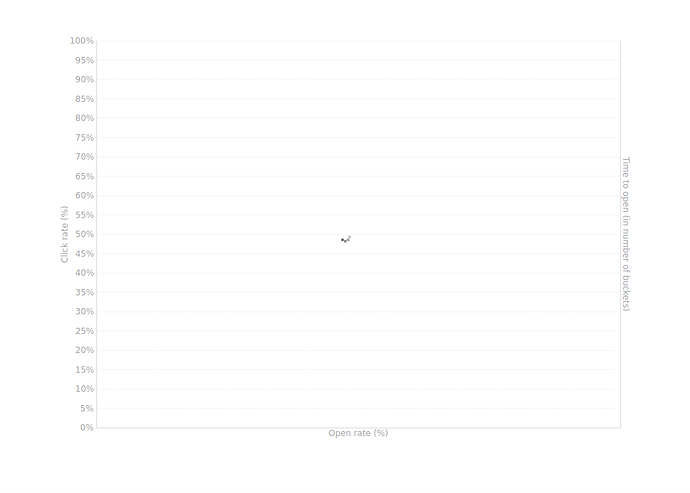
For instance, while the dashboard is loading I see this (left axis is of interest here):
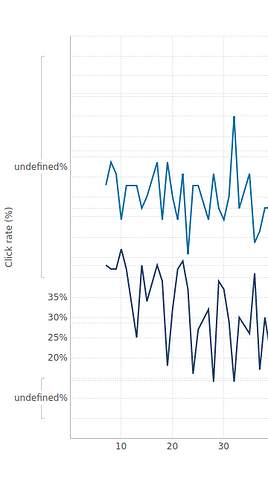
But once the data is in, I see:
where there are only legend points from 20 to 35, whereas I would still want to see 0% to 100%.
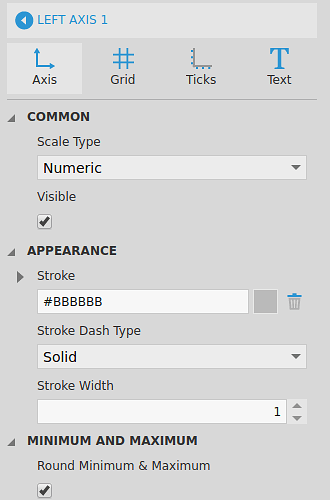
This is how I configured my axis:
With my custom minimum, custom maximum, custom offset and ‘show margin interval’, I expected to nicely see from 0 to 100 in the left axis.
Is there a way to achieve what I want to do?
On a side note, when looking at intervals for an axis, I can set them up in the ‘axis’, ‘grid’ or ‘text’ tab. I have no idea which one wins and I find it quite confusing 


