"Fixed calculation"? Reproducing the Tableau level of detail calculation

I’m a new Dundas user and am working to duplicate an existing dashboard.

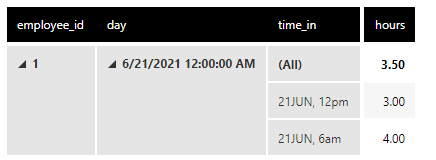
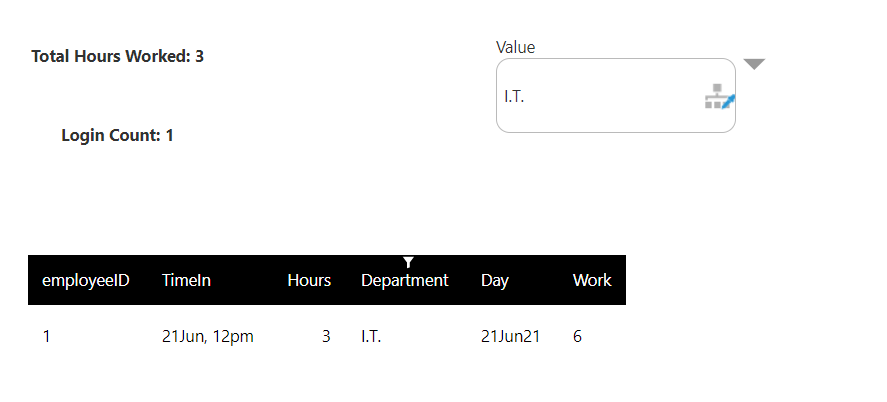
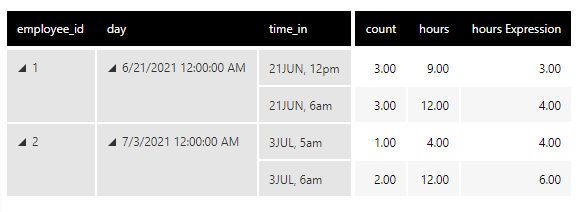
The existing dashboard uses Tableau and does a fixed calculation to determine the hours an employee worked. The goal of the calculation is to accurately report the number of hours worked. However, the hours worked appear multiple times in the data, once for each piece of work the emloyee did. The solution in Tableau was to do a “fixed calculation” like this: {fixed employeeID, Day, timeIn: avg(hours)}

The fixed calculation held each employeeID, day, and timeIn “fixed” and averages the hours reported for that timeIn. The average is used because there are multiple rows containing hours for that timeIn, but the hours reported are all the same so averaging them returns the desired hours value. The result is a single value for hours for that day that can be used in other calculations, such as work performed per paid hour.

How does one do this in Dundas?

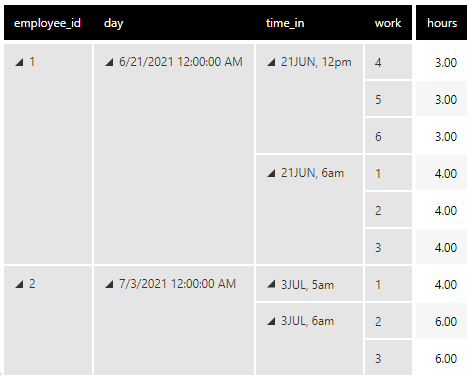
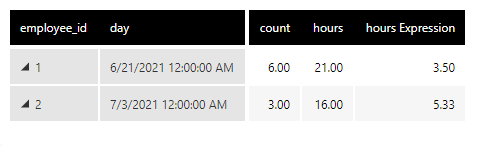
Sample data would look like:

 employeeID          Day                          timeIn                        Work                  Hours
          1                 21JUN21                 21JUN, 6am                    1                          4
          1                 21JUN21                 21JUN, 6am                    2                         4
          1                 21JUN21                 21JUN, 6am                    3                         4
          1                 21JUN21                 21JUN, 12pm                   4                         3
          1                 21JUN21                 21JUN, 12pm                   5                         3
          1                 21JUN21                 21JUN, 12pm                   6                         3

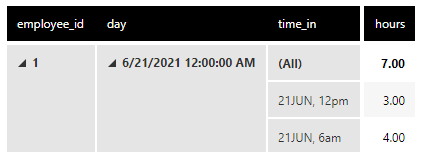
So the employee with employeeID of “1” had timeIn (logged in) twice on 21 June, at 6am and 12pm. He/she worked 4 hours under the first login and did work “1,2,3” and 3 hours under the second login, doing work “4,5,6”. A “fixed calculation” would report the total worked time on 21 June as 7 hours.

I didn’t find a function in the Dundas functions list or scripting tutorial that seem helpful.

Hi Thomas,

This can be achieved by changing the aggregators for ‘hours’ measure from SUM to AVG, which will calculate the total hours as average too, as in below:
image
To change the Subtotal value to 7 (3+4), you need to add a custom Total Calculation Rules (Rows) by editing hours measure and adding your custom calculation. In this case, it is simply SUM($hours$) and 3.50 changes to 7:
image

You can read more about custom total calculation in this link: https://www.dundas.com/Support/learning/documentation/analyze-data/using-a-custom-total-calculation
Hope this helps.

2 Likes

Upasana - thanks! I’ll give it a try.

Hi Upsana!
This will be helpful for showing totals on tables, however we also need this “custom totals” available to be used in calculations. LOD calcualtions in Tableau can do things like this: image

Is there something similar in Dundas? The example Tom gave is the first part of a common calculation we do when we’re getting production by hour by Associate, sometimes for specific segments, too. I’m hoping there are other Tableau converts that might be able to point us in the right direction, as I’m certain something similar is possible, just finding where/what it is :slight_smile:

(more on Tableau LOD expressions: https://help.tableau.com/current/pro/desktop/en-us/calculations_calculatedfields_lod_overview.htm)

Hi Rachel,

Yes you can do that by utilizing hierarchy alignment in formula measure. Check out the screenshot below where I calculated total vs total_by_region, the latter utilizing region dimension as an alignment for the sum operation SUM($total_rooms$, $region$).
image

You can do hosts of other things with formulas with explicit or implicit hierarchies. These two links will be very helpful, the first one detailing overall what you can achieve with multiple examples and the second one details about each of the operations you can do:
https://www.dundas.com/support/learning/documentation/analyze-data/formulas/adding-formulas
https://www.dundas.com/support/learning/documentation/analyze-data/formulas/list-of-formulas?v=8.0

1 Like

Hi Rachel,

If I’m understanding correctly, formula visualizations may help solve your problem. The Dundas documentation states “Formula visualizations allow you to use data from one or more visualizations to produce a new metric set (called a formula metric set) in a new visualization.”

As long as your hierarchy is placed in the slicer of the original metric set the data can be filtered using the parameter that appears under the formula metric set.

Using the example Thomas mentioned, we can use Upasana’s solution to get the total number of hours worked per day in a label. If we want to look at total hours worked by department we can add department to the slicer of the original metric set and then connect the parameter for total hours worked

Below is the result of adding a second department to the parameter control.

Hope this helps.

https://www.dundas.com/support/learning/documentation/design-view/formulas/using-a-formula-visualization

1 Like

I think I’m making some progress, but I’m not there yet.

Upasana’s suggestion from above allowed me to get closer to the needed results

I got this far by using this formula: image

It seems a clumsy way to get to the answer. The formula (I think) is averaging the hours reported on each line of data. The lines of data repeat the $hours$ worked during the $timeIn$ period once for each $unitId$ of work that is done. The formula then divides by the count of $unitId$ to remove the multiplication done by the fact that there are multiple rows of data during each $timeIn$ period.

The answer I’m looking for is given by this screenshot, with the correct hours shown in the last column to the right. This last column uses Tableau’s “fixed calculation” level of detail feature ( {fixed [username],[timeIn]:avg(hours)} )

The “hours” column is the sum of the value in the hours field over every row of data (for instance, 30 rows for May 2nd). The correct hours that should be reported for the day is 4.2, which Tableau finds by holding the $username$ that identifies the employee fixed, holding the $timeIn$ fixed, and averaging the hours across the remaining rows {fixed [username],[timeIn]:avg(hours)}. So for May 2nd, the $hours$ field contains the value 4.2 and is repeated across 30 rows (one row for each unit of work done, identified by $unitId$). Simply adding the $hours$ would give 126. Using the fixed calculation gives me the correct hours worked in the day, 4.2.

On May 3rd there are two $timeIn$ periods. The math works the same as as for May 2nd.

Tableau’s fixed calculation allows me to remove the $timeIn$ field from the display and still have the hours calculation work correctly:image

So now I’m able to get the correct hours reporting in Dundas as long as I have $timeIn$ as an element in the display. However, if I back out the granularity of the table, showing only May 3rd instead of the two $timeIn$ periods on May 3rd, the reported hours are shown as an average of the two hours values during the day instead of a sum:

How do I correct the problem of the daily/weekly/monthly totals only reflecting an average of hours on the days where there is more than one $timeIn$?

I appreciate your help! :slight_smile:

Hi Thomas,

Apologies for the delayed response.
You can do this by following the steps below: E.g. this is my dataset:
image
If you want hours and count of work, with granularity level in time_in, drag work in Measures as Distinct Count(Work). The aggregate level for hours is SUM. Next the formula measure added is simply $hours$/$count$:
image
Similarly, if you want hours and count of work, with granularity level in day, you can remove day from dimensions and the results will be: image
You can also put the time_in column in slicers in case you do not want to show them in the visualization but want to keep the option of filtering open. Let me know if this suits your requirement.

Upasana,

Thanks again for your patience.

This still isn’t giving me what I need. In the your last example, the “hours Expression” result on 6/21/2021 is 3.50 hours. This should be 7 hours, as the employee worked 3 hours starting at 12pm on 21 JUN and 4 hours starting at 6am on 21 JUN (from your previous table). Likewise, the result on 7/3/2021 should be 10 hours instead of 5.33 since the employee worked 4 hours starting at 5am on 3 JUL and 6 hours starting at 6am on 3 JUL.

Hi Thomas,

The ‘hours Expression’ is the results of dividing hours/count. If you see the second screenshot, for employee_id = 1, the hours are 9 (3 + 3 + 3) and 12 (4 + 4 + 4) because they are summations of all the hours corresponding to the work measure. You can change the aggregate level to avg(hours) to get 3 and 4. It would be better, if you can give a screenshot of your exact requirements based on the data I provided in the first screenshot.

1 Like

Upasana,

I’ve got it working! Thanks for your help. The key was what you suggested in your reply to Rachel above.

Here’s how I understand it, with reference to how I learned it in Tableau. This explanation would be helpful for anyone else coming from the “Tableau world”:

Dundas uses commas to designate the fields to use when doing a “fixed” level of detail operation.

This formula gave me daily CPH for a single employee:
SUM($unitWeight$,$calendarDate$,$username$)/
SUM($hours Expression$,$calendarDate$,$username$)

I read this as “give me a sum of unitWeight, holding claendarDate and username constant” and divide by “sum the hours Expression, holding calendarDate and username constant”

Similarly, I got the monthly (or selected period) average CPH for a single employee using this: SUM($unitWeight$,$username$)
/SUM($hours Expression$,$username$)

By leaving calendarDate out of the “fixed calculation”, Dundas added everything up that wasn’t filtered out by the date range filter.

Some more tinkering got me here, very close to what I need:

3 Likes