I have a measure with the year as a hierarchy. I need to display the % change in the measure since last year on a radial gauge as shown below. How do I achieve it?

I have a measure with the year as a hierarchy. I need to display the % change in the measure since last year on a radial gauge as shown below. How do I achieve it?
Hi @ravi.bansal,
To build this, you need to do this whole thing with mulitple controls.
From Above:
1 Bar Chart - Seperate metric set from the other 3. I’m using multiple metric sets to create two series, one for each year.
1 Pie Gauge : See metric set below
1 State Indicator : See metric set below
1 Data Label : See metric set below
It’s fairly easy to create but you need to start with a single metric set that calculates everything that you need.

Measures:
Revenue - Your base number that you need to display
Revenue Pop-1Year - This series is calculated using the Data Tools -> Period over Period
Revenue Pop-1Year Expression - This is a calculated series to get the percent difference based on the above two series. Please name this better than i did. 
Here is my formula: ($Revenue$-$Revenue PoP-1Year$) / $Revenue$
Rows:
Date - A date field that is filtered to the year that you want to display so that you are only getting a single value.
Once you have a metric set with everything, you can copy is multiple times and set it up to display in each of the four visualization types that I showed above. Each will take a bit of tweaking with the properties but shouldn’t be too hard to create.
If you have any trouble come find me.
cheers.
Thanks, @jeff! It worked. I also need to make sure that bar chart colors change depending on the PoP difference in the measure value.
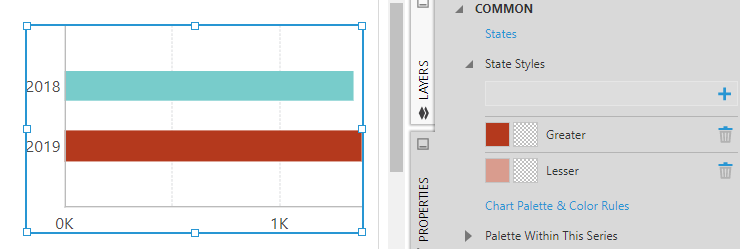
If Measure value increases PoP i.e. x(prev. year) < x(curr. year) then chart should be displayed in green shades.

And if x(prev. year) > x(curr. year) then it should be displayed in orange shades as shown below:

Is there a way to change Bar colors depending on the PoP measure value?
Hi @ravi.bansal,
You can do this with states but if you created the chart using two metric sets, states don’t work across metric sets. There is a way but i prefer the scripting solution as it’s a lot more elegant.
You can set the colours using the concept in our sample:
https://www.dundas.com/support/developer/script-library/controls/using-different-brushes
You can also pull the data out from the metric set binding object:
chart1.metricSetBindings[0].dataResult.cellset.cells[0][0].value
and
chart3.metricSetBindings[1].dataResult.cellset.cells[0][0].value
Just create a script in the data loaded event.
Hi @jeff,
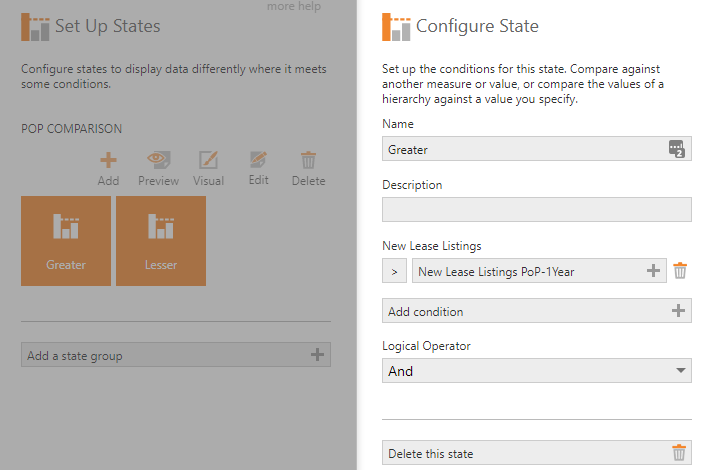
I am not very good with scripting so I am trying to achieve it through States. I have set up a state group “PoP Comparison” with 2 states “Greater” and “Lesser”. “Greater” state checks if measure X>X(prev. year) and “Lesser” checks if measure X<X(prev. year).
Implementing the states, only changes the color for Current Year value.
Hi @ravi.bansal,
Can you please provide some details on the metric set, how you built it and what you have created the status with. If i can replicate what you have, i can try to find some suitable steps for you.
Hi @jeff,
It’s a simple metric set created as shown below. The “New Lease Listings PoP-1Year” is invisiable on the chart.

Following are the states I have created.


Please let me know if you need any other information.
Hi @ravi.bansal ,
As i understand it, you have a DateTime series showing two years with a POP-1 series. Like this.

You’re now hiding the POP-1 series but it’s still there such that you can compare against it.

You want to apply the states against the POP-1 series to get this:

You can see that it does colour both series. Now… I had a similar issue to what you described where only the second is coloured but i can’t seem to reproduce it every time. I’m unsure the cause but it’s probably something more suited to the support team to investigate if it’s becoming an issue. I was able to make this work by first using a data table visualization before applying all the steps above. Give it a try, i think it will work for you. At the very end, turn it into a bar chart and all seems to work.