Display additional dates on axis that do not exist

Hi,


Just wondering if there's a way to do this.


Let's just say I have this data

Date Data Value
Jan 2017 1
Feb 2017 2
Mar 2017 4
Apr 2017 6


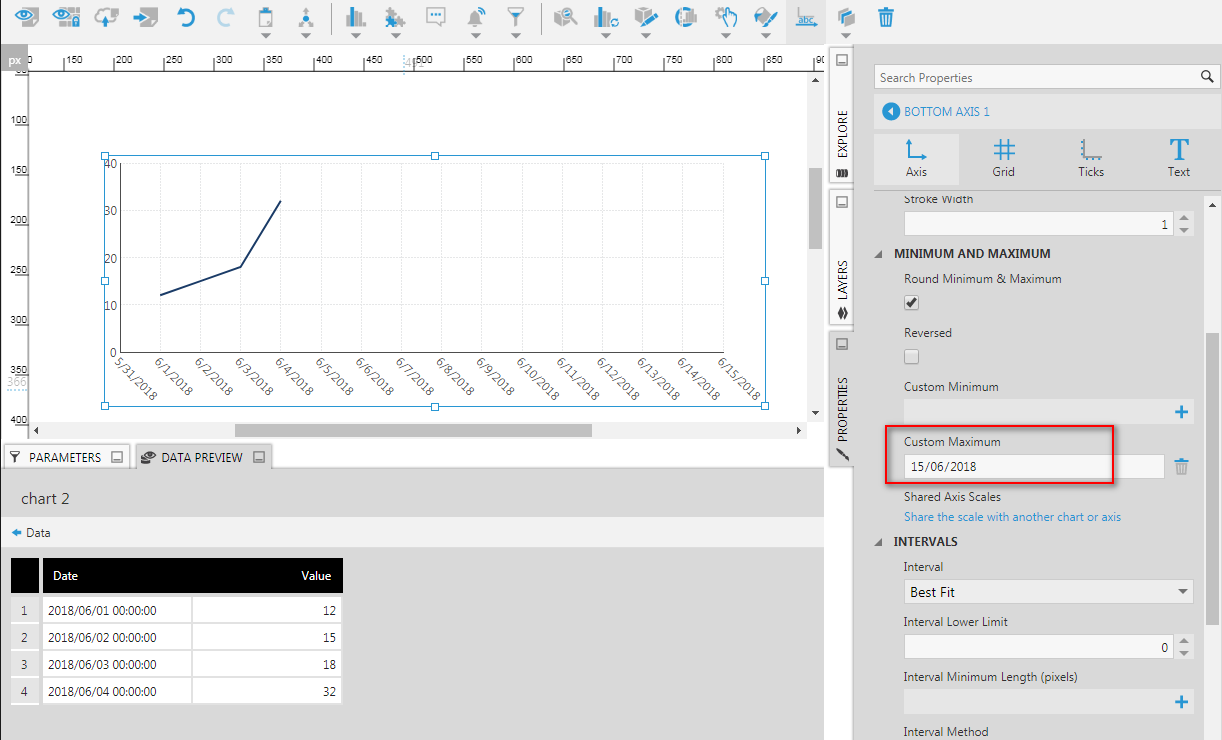
I can create a line chart fairly easily that has 4 data points, but is there a way to create a line chart that displays the data from Jan 2017 - Dec 2017 if I don't have the rows of data in my cube? (May 2017 to Dec 2017 data does not exist in the cube)

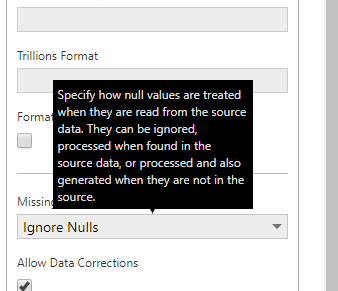
The only solution I can think of is by placing "dummy" data in my cube for the rows missing but I would rather avoid doing this.

Any help would be appreciated.

Thanks in advance!

Image title


I have used this but I only only seen it work to source data inbetween data points.

say for the year of 2017 you had December, July and September missing.

You can have it show the missing July and September for sure. but not sure you will get December.

Unless you are combining it on another chart (two chart in one that has data for all of 2017 then it should.


ps

ignore null is not teh otion you want try source or full.


You can set the chart's bottom axis to show a "Custom Maximum" value. From the example below, only data for 2018/06/01 to 2018/06/04 is available. Setting the Custom Maximum to a certain future date (e.g. 2018/06/15) will show the end of the range of values displayed along this axis.


Cool, I learned something new. This is why I read as many of these threads as I can.

Here is a more complete sample on how to display data outside your available data. This does not make use of the Custom Minimum and Maximum axis values, but rather make use of Time Dimension and then filtering outside the available data.