We use primarily ORACLE and our users are accustomed to seeing a dd-MMM-YYYY date format in their reports whether the data is viewed on a webpage, as a downloaded pdf or excel file.
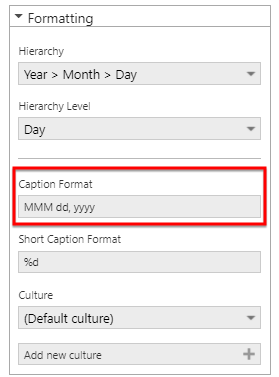
I’m not finding the option to make my YEAR > MONDAY > DAY time dimension show up in that format on their metric set or in their exported data. For the metric set I know I should be able to rormat it like so:
[<DATE_EARNED>:dd-MMM-yyyy]
But it is not working and based on my reading would only after the webpage / visualization anyway.
For the downloads I do know they can just reformat the column in Excel with that data in it, but that’s a lot of fussing with data for each report that I’m converting from our old format.
I’ve read the support docs but they don’t explain how to do what I’m trying to do:
https://www.dundas.com/support/support-center/support-articles/data-visualizations/table/display-date-only-on-column-instead-of-date/time
https://www.dundas.com/support/secondary/formatting-text
Is there a way to ensure that the DATETIME data exported shows up in Excel as dd-MMM-YYYY?