Is there a way we can show the visualization data along the x-axis in the charts ?
Datatable along x-axis
Could you be a bit more specific? the only guess I have is to simply put a table visualization under the chart.
If that is what you mean, edit the metric set for the table to transpose it and remove the totals:
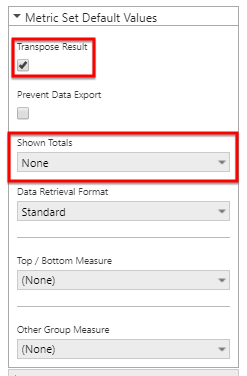
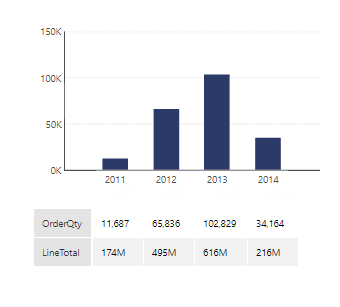
In the following example, I have OrderQty in the chart while both OrderQty and LineTotal are in the table. I have also changed the Column Header Style and Corner Header Style (in the Look properties) to be transparent.
Elia,
I am trying to attach pic for it but it is not letting me. Please see the data table section in the below url. This is what I intend to achieve.
http://support.dundas.com/Dashboard5.Chart_Usage.ashx
In that case the solution I gave you should work.