Colour bubbles based on quadrant

I’m trying to reproduce a Tableau quadrant chart.

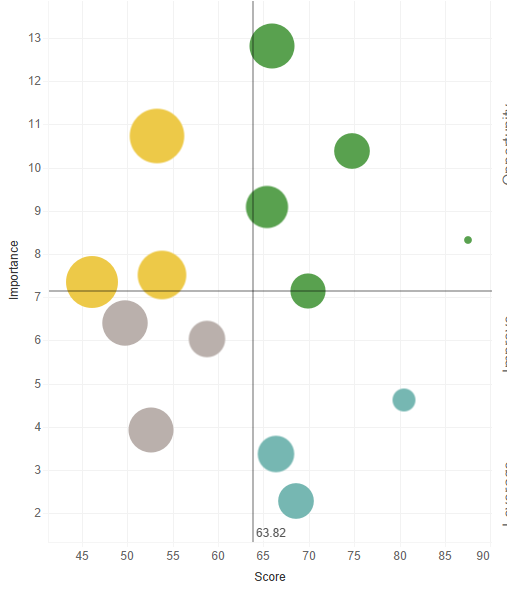
I can do the bubbles using three measures, for the vertical and horizontal positions as well as the size.
I can also do the lines using another two measures which are an average of the horizontal and vertical measures.

However, I want to colour the bubbles based on the quadrant that they are in. I can’t do it using states or colour rules because it would need to depend on both the horizontal and vertical measure, and they will only work off one.

Any ideas?

Hi David,

Since you have the median values for each of the measures used in axis, and the x-values and y-values for each bubble/data point, you can create a formula measure to assign quadrant numbers to the data points based on conditions E.g.
if (x-value of a data point <= median value of x-axis && y-value of a data point <= median value of y-axis) {
return 3; //means third quadrant
}
else if (x-value of a data point > median value of x-axis && y-value of a data point <= median value of y-
axis) {
return 4; //means fourth quadrant
}
and so on…
The new formula can be used to color the bubbles directly under Visualization tab. I did it roughly and it looks like below - you can try and let me know if this will work in your case.

image

Hi @upasana

Yup, exactly what you said. I stepped away from the computer for an hour and this solution popped into my head too.

Thanks

1 Like