Break Links to Metric Sets?

Hello,

Does anyone know how to break links to metric sets for dashboards? When I first started building dashboards I used the metric set builder to drag and drop. I have noticed however when you do this it changes the original metric set if you make tweaks in the dashboard. Is there a way you can break this link to the original metric set so it doesn’t change when changes are made on the dashboard?

1 Like

Good Day Patrick,

I am making the assumption that you are on version 8. Typically, once you drag a metric set onto a dashboard, any changes you make on that dashboard visualization would not reflect on the metric set, unless you click the “Update” button on the Data Analysis panel(see screenshot below). If you have been clicking this button when making tweaks to the dashboard, that could explain why your original metric set visualization changes. Else, that shouldn’t be the case at all. Hope this answers your question, let me know otherwise. Cheers.

Hello Lotachukwu,

I am currently on version 8.0.1.1002

That doesn’t seem to be the case, please see my original data analysis panel in my first screenshot.

image

I have exported the metric set to a dashboard and made a few changes. Changes can be seen below

Upon checking in the dashboard (I have not clicked update) I return to the original metric set. The visualization does not match the visualization in my newly created dashboard but new rows are present.

Good Day Patrick,

If the visualization on your metric set stayed the same, the changes you see might be coming from the underlying data source your metric set is connected to. Was your metric set built using an excel file? Data cube? or Data Connector? Have those sources been modified in recent time? Do let us know.
Screenshots of your dashboard visualization and the visualization on your metric set would also be handy.

Warm Regards,

Lota

Hello Patrick,

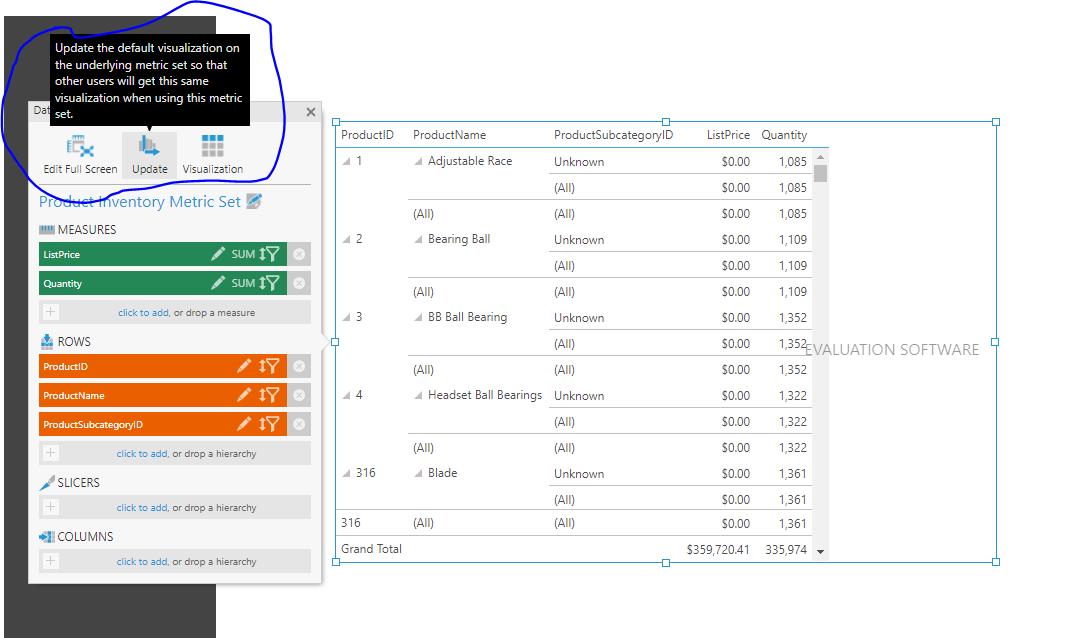
Quick Update: In summary, there is no way to actually “break the link to a metric set”. When you use a metric set on a dashboard, changes you make in the “Data Analysis Panel - Metric Set” affects the metric set itself. the default visualization for the metric set would remain the same, but would reflect the changes made in Data Analysis Panel. What the update button does is that it updates the default visualization of your metric set to reflect that on the dashboard. (Apologies, I was wrong in my initial response, I should have been more thorough).
That being said. Here are some available options:

  1. You can build the Metric Set directly on the dashboard (but it’s no longer reusable - it’ll only exist on that dashboard)
  2. Build out multiple Metric Sets for each dashboard
  3. Make multiple copies of a ‘base’ Metric Set to fit your needs.
  4. You could also just build out one Metric Set and simply change the visualization itself to not show certain rows/columns/measures if you don’t want to do the multiple metric sets route. ( You can do this by clicking on “Visualization” in the metric set Data Analysis panel).

Hope this sufficiently answers your initial inquiry.(Honorable mention @mark.barciak for his assistance with this) .

Regards,

Lota.

Hi Lota,

this latest explanation is exactly what I am seeing, I have found that building a metric set directly in a dashboard seems to be the best strategy and also seems to allow you a little bit more control in the build. I started building using just the metric set builder but then things started to get very cluttered with all the additional copies I needed to make. With that being said, we have many earlier versions of reports with these metric sets and links that I would want to “break”.

I’ll dig around to see if I can think of anything else that might be able to trick this link and let the forum know.

1 Like