I have to recreate the following
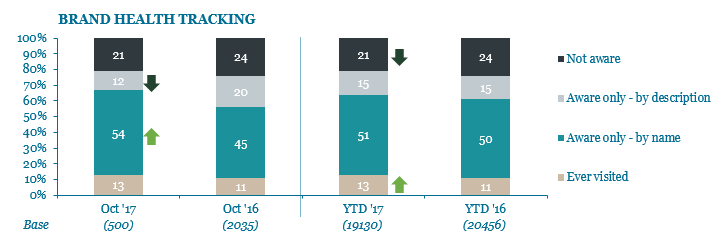
There is a statistical test that I do on the data that determines whether there needs to be an up arrow, a down arrow, or no arrow at all next to each section of the current period stacked bar column.
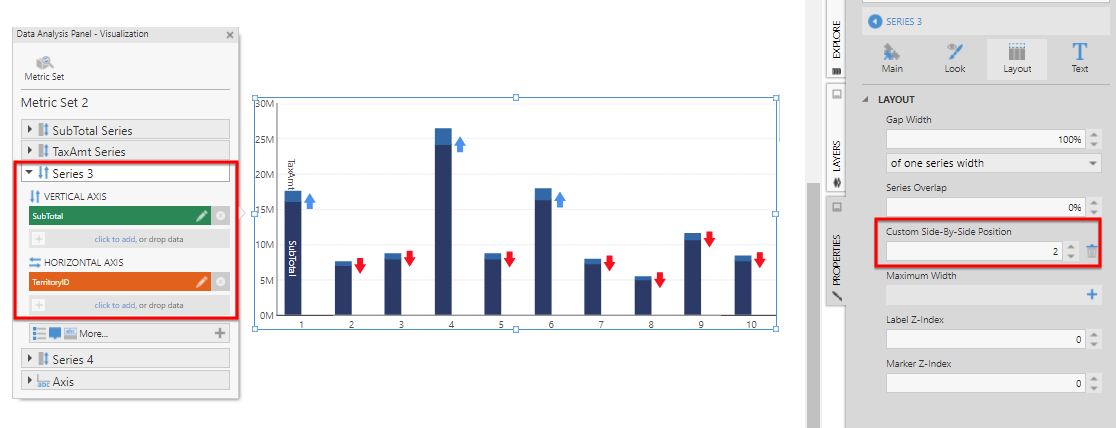
I can do the test in a script, and I can insert the correct arrow image on to a dashboard. What I am having trouble with is determining the position of the arrow image. I could perhaps hard code the left position although I would prefer not to, but I need a way to script the top position.
Is there any way (however convoluted or stupid) to work out the center Y position of each segment of the stacked bar? For a bonus, is there any way to work out the X position of the column edge?
(I cannot determine using the chart height, because the object includes the x axis too.)
All ideas welcome!