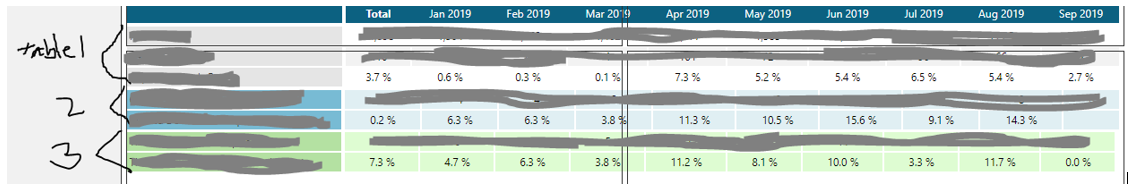
I am trying to integrate several tables which all have the same column headers (YTD months) to look like one table with the headers only showing in the top one. I am doing this because I want to apply different slicers to each section of the overall table.
I would like the column width to be synchronized between the tables so that they line up. I don’t want to set a hard column width, however, because I would like be able to auto fit columns to fill the space available depending on how many months are displayed.
Is there a setting available for tables that is similar to the “share scale with another chart or axis” feature that is available for charts?
If it makes a difference, I am working with transposed tables for this.
Thank you!
Align Columns Across Multiple Tables
Hi Molly,
Unfortunately, currently you cannot link multiple tables to share column widths.
In your scenario, you would have to create a Data Cube that would combine the data your 3 tables have and display that as one table.
since you want to apply different slicers to each section, after combining them into one Cube/Query try making a column that has a flag or something that you can slice on to achieve the same result as having them as three separate cubes.
You might need a column for each slicer.
Yea, thanks that’s what I was trying to avoid doing because I already have a ton of flags on this particular cube and I was hoping I could get away with not adding more. I gave an example of 3 tables, but there are actually 7 or 8 and I’ll need to do fussy combinations of the different slices to get them all in one table. I also wanted to highlight some rows with different colors, but not exactly sure how or if I can do that with transposed tables. Maybe in a script? Thanks for the input!