Which vizualization is this?

I’ve got a request to create this chart

image

It’s like a grouped bar chart - where each of the three outer sections groups three inner sections, with the bars filling up outwards depending on the value of each subsection.

What type of vizualization is this in Dundas BI? Is it a pie, a radar or something else? What should I start with to achieve this chart?

Thanks

Hello @david.glickman,

I think it’s a radar/spider chart. You have 3 variables and the bars from inside the chart are measuring something on an axis. Another argument can be that all values(bars) are starting from the center of the chart which is specific for a radar chart.

Hi @costin.manea, I agree with your logic, but I can’t persuade the radar chart to look as I need it to

1 Like

I’ve sort of got it working with a pie chart.
I’ve got a number of rings, and am trying to use states to switch off the sections where the number is above a value - see screenshot below.

I’m not sure about how the various states work together - if one is true, then it seems that others don’t work. More thought needed.

1 Like

Hi @david.glickman,

What are the values representing? This reminds me of a Nightingale or Rose Chart, something like this.

Is this doing anything differently in your mind from this image?

Doesn’t Radar need a to have a Time Hierarchy for the outer ring? or at least works best that way?

For most of the best examples i’ve seen, yes, a Time Hierarchy makes a lot of sense. Make it work like a clock. … Or a compass. N S E W

A pie (or sunburst) is one option because aside from getting the colors to change in this particular way the result you want looks a lot like a sunburst. The way a state group works is that it can be in only one state at a time, so you can set up multiple state groups (probably each with just one state) to allow for the data to be in more than one state at the same time. The “Donut Hole Size” option allows you to reserve that empty space in the center for a data label.

A radar chart is another option, but since we don’t have a dedicated rose chart right now, it involves getting the Radar Area or Radar Range to draw the shapes you want. This is more of an advanced setup where extra values are needed to describe how each data point is shaped. You can get an empty space in the center by setting a Custom Minimum on the radial axis to a negative number, although it still draws grid lines there. This is using a Radar Range series, where each data point is bounded on 4 sides by 4 different measure values:

Thanks @jamie.cherwonka, that looks about what I need. I’ll have a go tomorrow.

I’m entirely confident to say ‘yes’ to whatever I’m asked to do, and know that in Dundas it is possible somehow, and with the help of you guys

1 Like

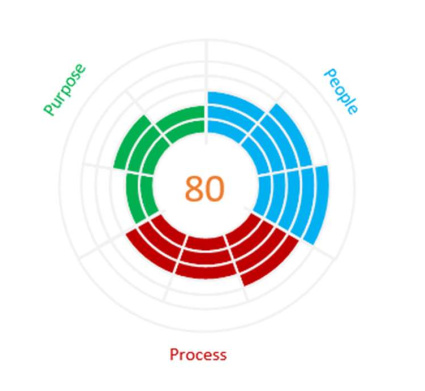
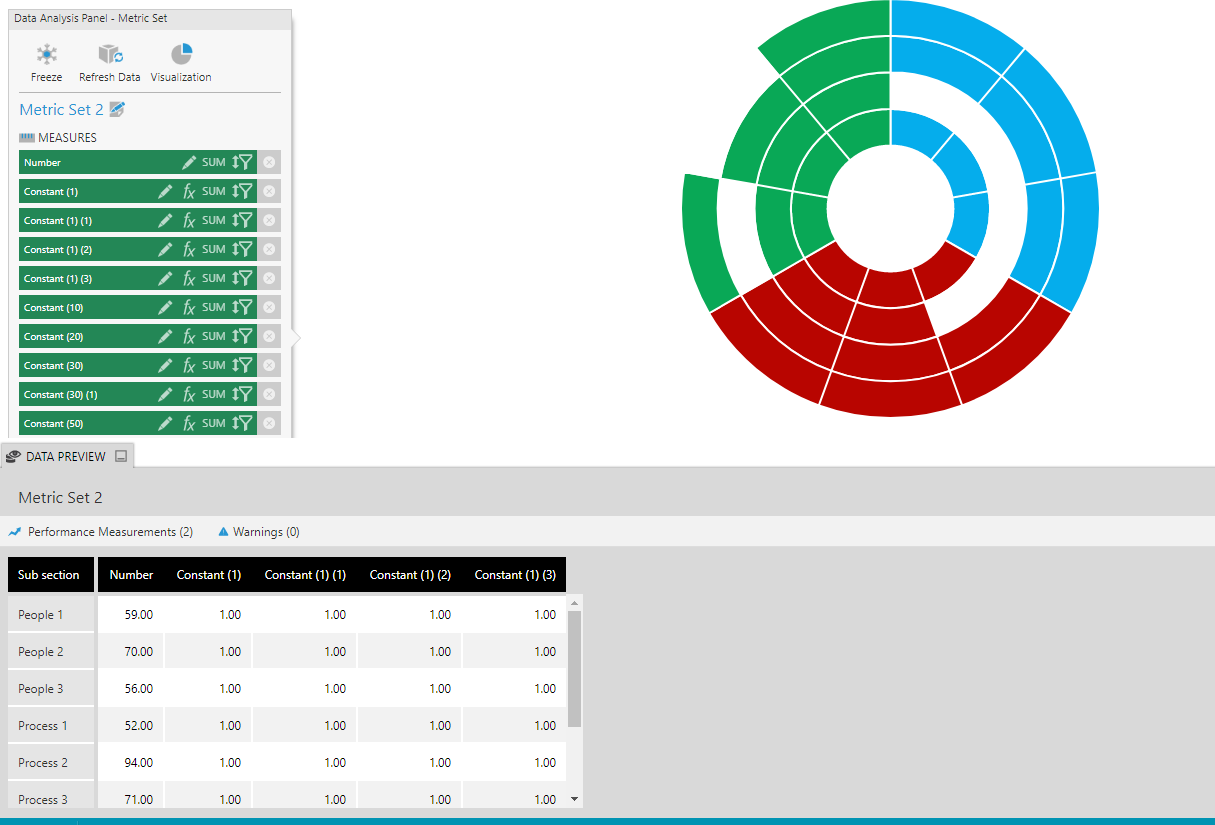
The values are representing scores that people gave for each section.

It’s not the going round the circle that is important, it’s the distance that each bar goes from the middle. So if you were with a perfect circle around the outside, then your company is balanced on all metrics. If it’s far out in one place and not in another, it means that people perceive your company to be more of one thing than another. It’s the effect of seeing the whole blob of colour moving towards one side of the circle.
We see this quite a lot with our market research clients, they have their categories and subcategories in a very specific order around the ring so that they can see which areas they’re skewed towards.
I think this gives all the metrics an equal balance as they all start and end in the same place from the centre visually, which is not exactly the same effect given by the bar/column chart.

It’s a different use of the radar from the one mentioned by @james.davis, maybe it’s market research industry specific rather than BI.

YES!! @jamie.cherwonka it works.
Dundas is great!

Happy it worked for you!

This is an interesting visualization @jamie.cherwonka, can you please publish a project along with the data that you use for making this. I would love to see how this was done.

@luis.silva It’s not much more than is in Jamie’s screenshot. A couple of vizual properties need set in the chart (colours, labels, axis look and z index etc.) and it just works.
I’m not sure I can publish mine publicly though

And I asked what they call it - it’s officially known as a ‘circumplex’ visualisation

Hi - Unfortunately we can’t post projects here, but the trickiest part about setting up a radar chart like that is getting the data and settings in that screenshot like David said. It’s probably also easier to use a sunburst chart for this particular chart.