Where does formula visualization data come from

I have 40+ charts where I use a formula visualization that pulls from the same metric set (it’s just the denominator.) I needed to update the filter on this metric set and I did not see it update the data of the 40+ charts where the visualizations is used.

I don’t understand, how would the visualization get new data if it doesn’t pull from the component metric sets? The documentation is very opaque. If I have to rebuild the metric sets again (can’t use click to add? have to reapply style? and redo entire visual?) then my Dundas journey is over.

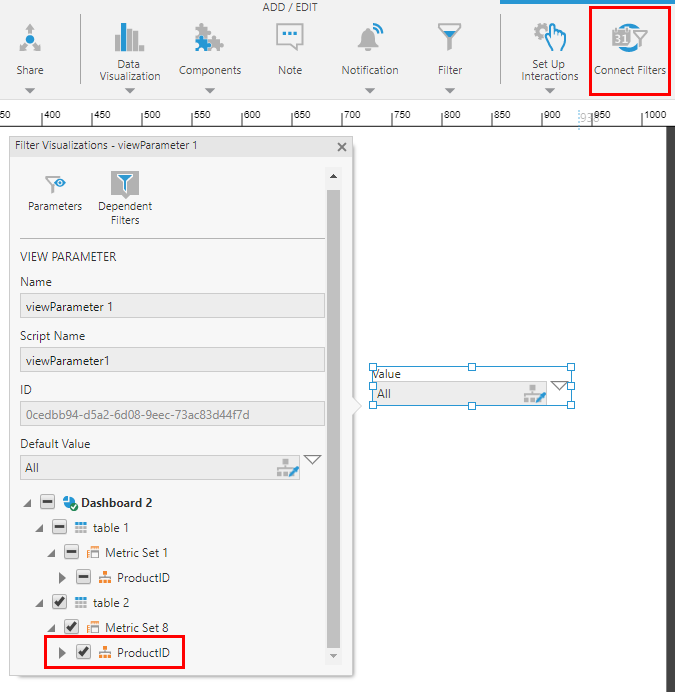
The solution is to use a parameter filter i.e. you don’t need to drag and drop onto the hierarchy panel. Dunas plz document! Amazing feature.

1 Like

That is correct. This is indeed documented under filtering formula visualizations:

https://www.dundas.com/support/learning/documentation/design-view/formulas/using-a-formula-visualization#h6-filtering-the-formula-metric-set

The result of creating a formula visualization is a separate metric set, which is completely independent from the original metric set. This means it’s safe to delete the original visualization if you don’t need it; otherwise, the two metric sets now work independently, including their sorting and filtering. If you have placed filters on your dashboard, you will need to connect them to the new metric set for it to be affected.

To connect an existing filter on the canvas to the formula visualization, click to select it while editing, then choose Connect Filters in the toolbar. When adding a new filter, the same Filter Visualizations popup appears automatically: