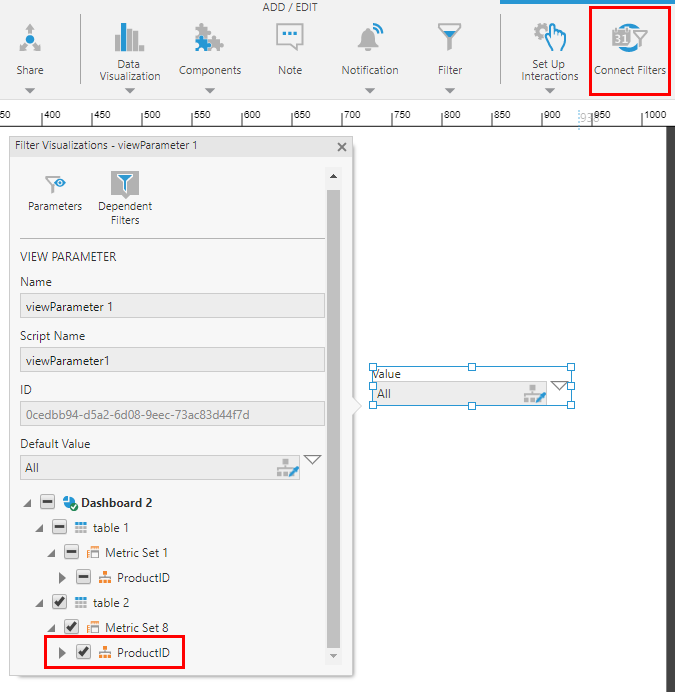
I have 40+ charts where I use a formula visualization that pulls from the same metric set (it’s just the denominator.) I needed to update the filter on this metric set and I did not see it update the data of the 40+ charts where the visualizations is used.
I don’t understand, how would the visualization get new data if it doesn’t pull from the component metric sets? The documentation is very opaque. If I have to rebuild the metric sets again (can’t use click to add? have to reapply style? and redo entire visual?) then my Dundas journey is over.

