Row matching between metric sets after the sorting of one

The problem I’m facing is that I have two metric sets. One is a formula visualization and the other is a metric set that has similar data. These two metric sets need to have their rows align at all times. However when using the dundas sorting by “Ascending” and “Descending” the rows start not aligning. Since these two aren’t connected I was wondering if there was a way to link the rows to align after either metric set was sorted. They share the same row hierarchy. They will always have the same number of rows by the nature of how it was constructed.

There is also another problem where if you sort the two metric sets both by ascending or descending they won’t necessarily match. The formula visualization is a percentage that doesn’t always share the same order of ascending or descending.

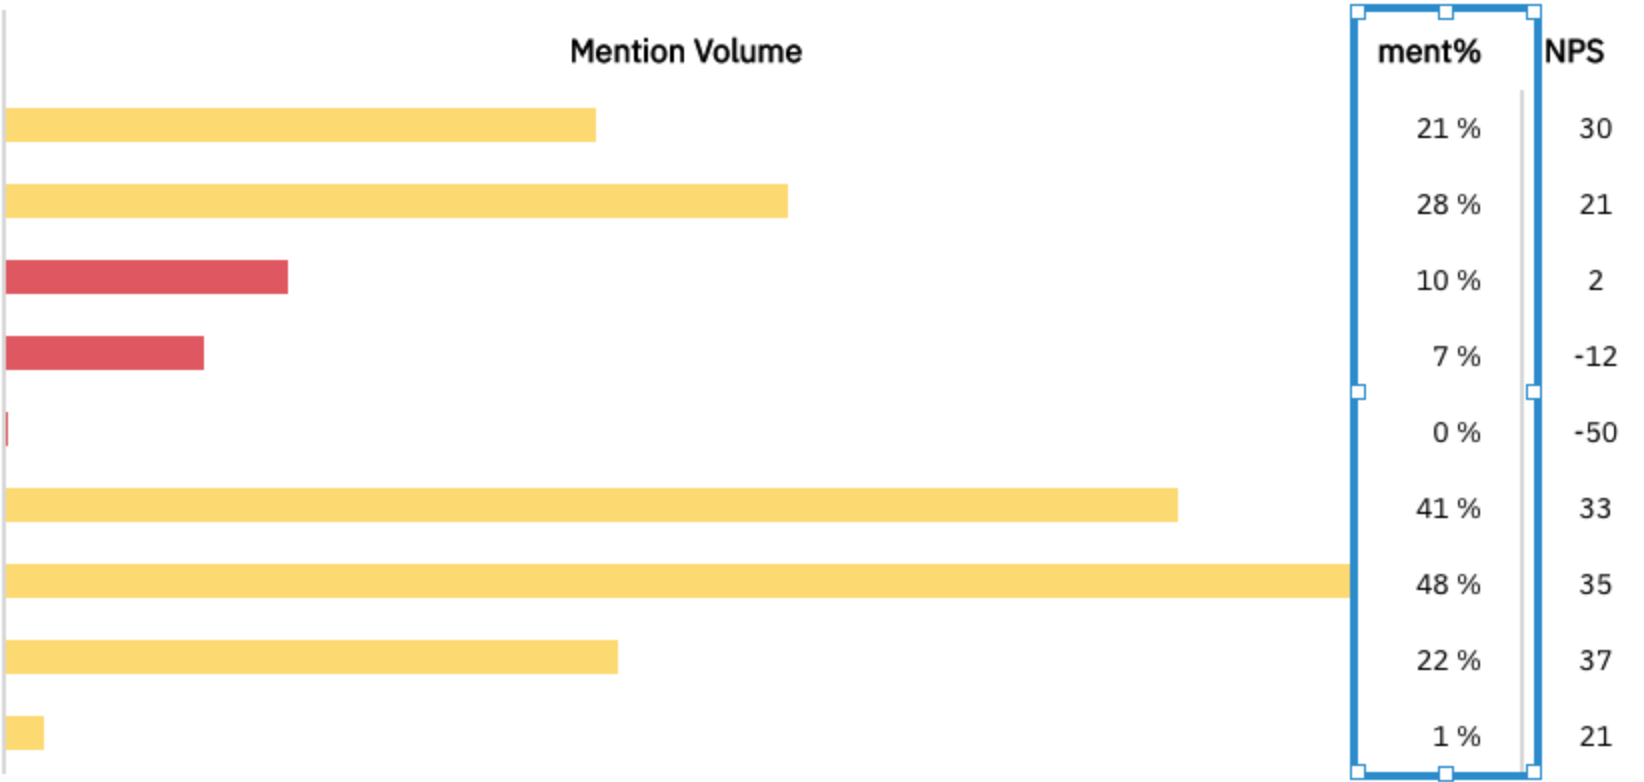
I’ve added an image i’m not sure if it will load or not though.

Not sure if there’s a built in way to do this - I wish there was.

What I’ve done in similar cases is to include the column that metric set 1 is being sorted by, into metric set 2. So metric set 2 has metric set 1’s sorting column included but hidden, and is sorted by that.

1 Like

Hi,

To keep each pair of values together while sorting the rows, you really do need to add the two columns to one metric set (but having one metric set contain all the data you want displayed is usually better all around). If the metric set that the formula visualization is based on contains the other measure, you can just drag that measure into the Data Analysis Panel of the formula visualization to add it. Otherwise, it’s possible to create a formula visualization that combines both columns instead. Please try it as shown here and let us know how it goes: https://www.dundas.com/support/learning/documentation/design-view/formulas/using-a-formula-visualization

1 Like