Recreating Oracle Report formatting with Dundas?

I have submitted this to support, but wonder if anyone else has done anything like this?


Hello,


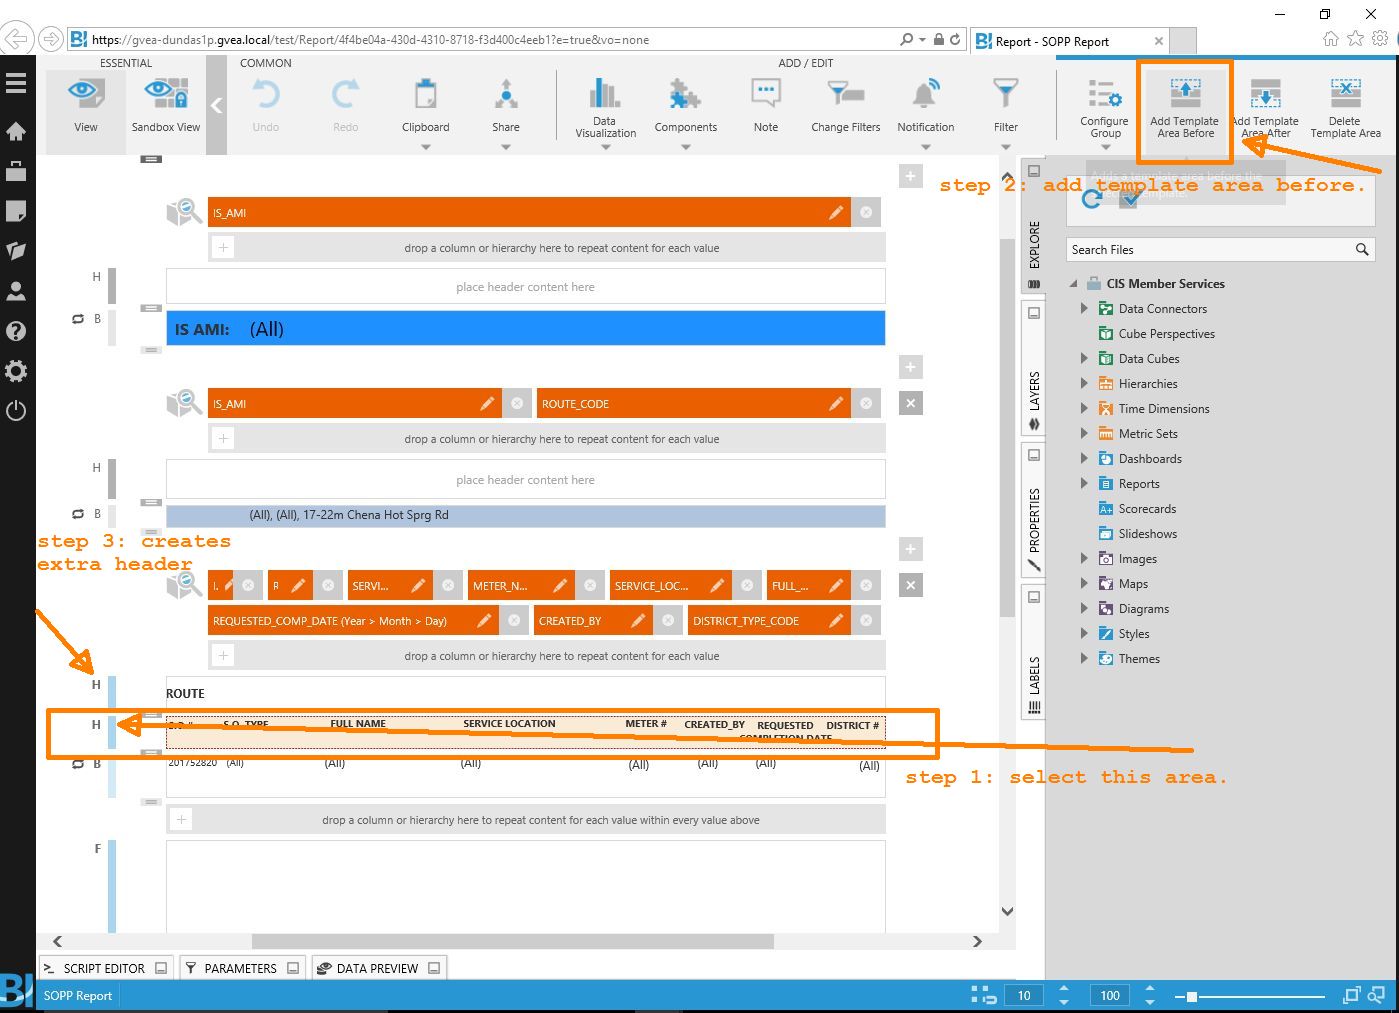
I’m trying to reproduce a report currently created by Oracle Reports, although the preference is to use the Excel share instead of a the pdf that they had. I’ve got most of it worked out, but one of the requests is to group the data by ROUTE_CODE (as seen on the screenshot, which is relatively easy to do in Oracle Reports) but to either have blank lines between the different groupings or be able to display it like the pdf shows.


I could use some advice on how to do this or if it is even possible. (Note the data sets are different, it’s the formatting based on ROUTE_CODE I’m interested in)


Oracle Report, note how the route is a light blue bar above each set of records for it:


Image title


My Excel file thus far. I don’t need to have the routes grouping above each set, but some kind of visual / physical separation would be nice, not color-coding though:


Image title


Can't this be done easily in Reports? I'm still pretty new to Dundas BI but I think that's what you're looking for.

This will help some on how to use reports and scorecards.

http://www.dundas.com/Support/support-center/support-articles/reports-scorecards/


I only spent 30 minuets trying to make a report, still learning them myself.

I will take a stab at this. Reporting can be very complex to get the output to look exactly like what you want. Sometimes you can pull SQL tricks ( hacks ) to make the data easier to work with.

One way to add a blank line in the report is to add a blank row to the data result. Mostly blank that is, keep Route_Code.

Create a new field 'SortKey' in your original cube where the default value is zero.

Create a new cube. Use a cross-join against your original cube with the data grouped on Route_Code to get one blank row per group. The blank row has 2 filled in values, Route_Code and SortKey. Add the other fields that you need to make the output of both cubes the same. These fields will be blank placeholders. Make the SortKey = 1 for the new cube results.

When you union your original cube results with the blank row cube results, viola.

In the visualization you can Order By Route_Code and SortKey.

Hope this makes since. But, remember, this is a hack.

Looking forward to seeing other peoples solutions for this!

Good luck!

Great idea Matthew - I would also use some variation of your hack.

I also contacted Support on this and they told me to use a scorecard. I’ve tried to create a Scorecard and I’m not understanding what I’m doing or how to get the results I’m looking to produce. I’m hoping to get a support call tomorrow to walk me through the steps needed to get my results.


I can do the SQL hack and thought about that first, but supposedly this functionality is built-in to Dundas so I’m going to try to do it their way. I’ll let you know what I find out.

After a TON of GoToMeeting support calls and a lot of hours, I have my report, more or less. I still have a couple of small things to work out:

  • Figure out is how to get it to sort by the ROUTE CODE correctly.
  • Figure out how to get pagination to not spilt


I tried a scorecard first, but ultimately ended up with a REPORT. The report has three layers of repeaters and the real trick involved adding a “TEMPLATE AREA BEFORE” on the innermost repeater. Support walked me through this step and this screenshot is just the result of how I got to the results I needed.