Radial Gauges - Max Values & Targets

Hi,

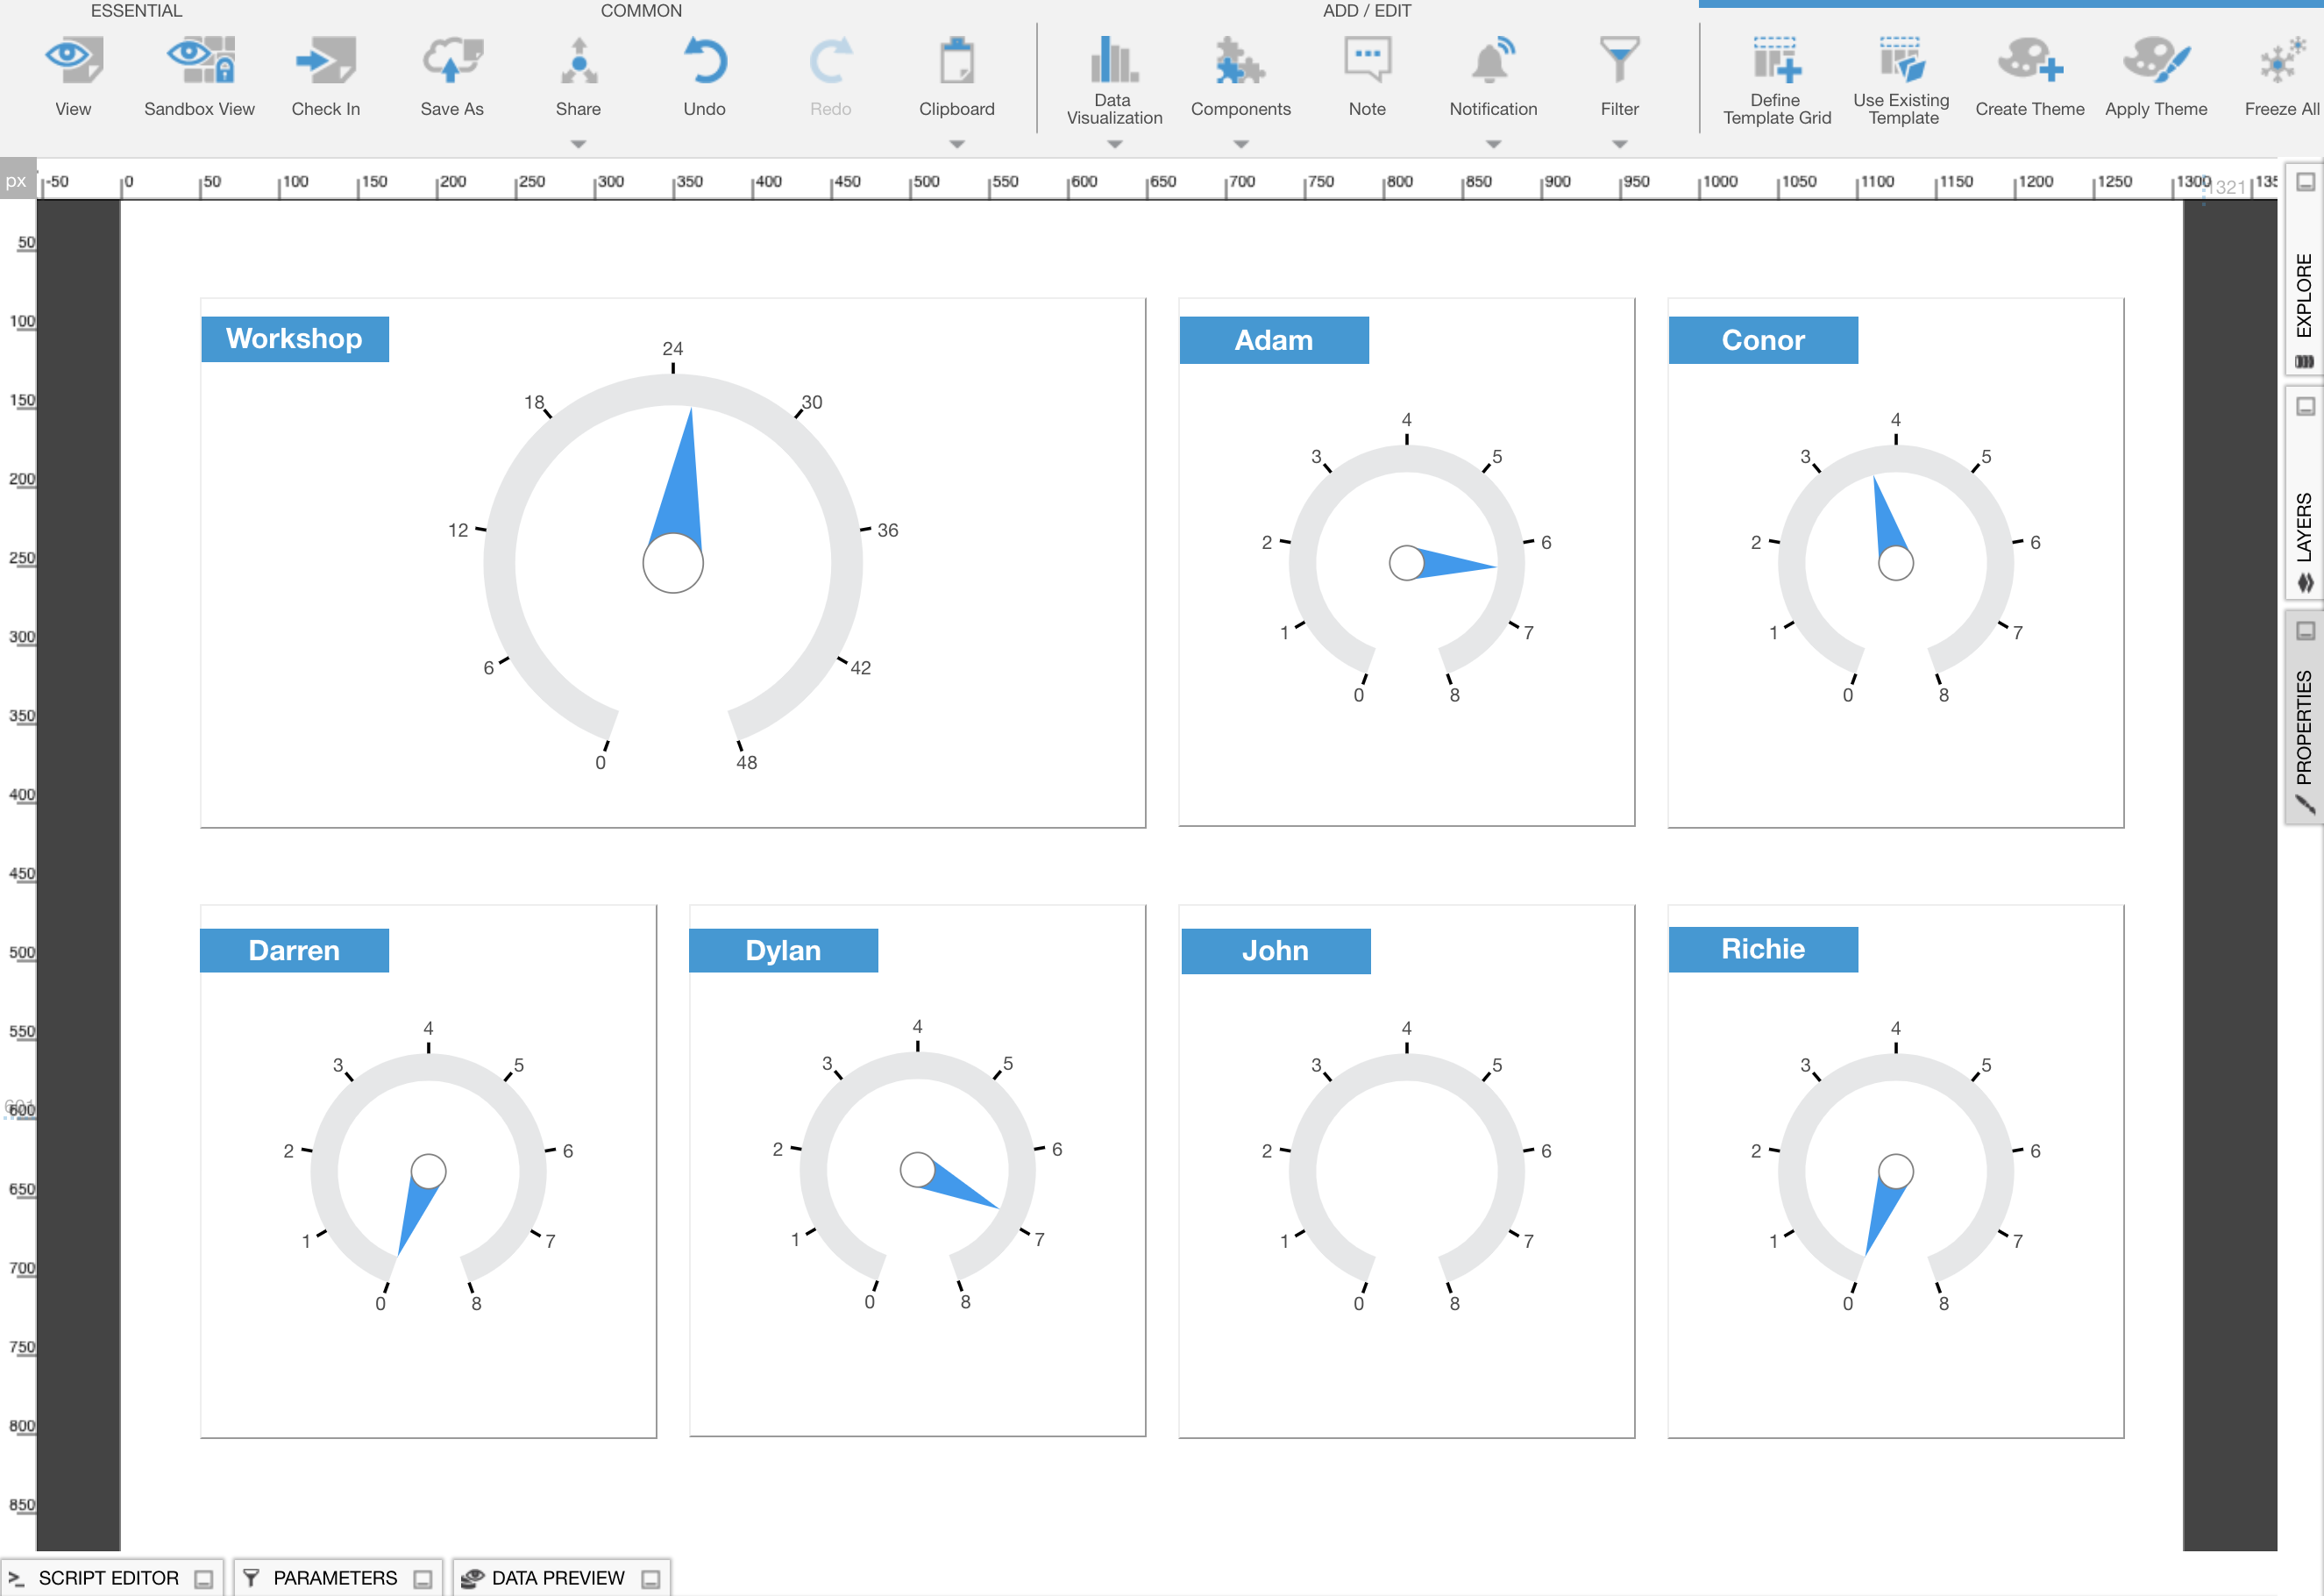
I am working on a dashboard (screenshot atatched) that shows the number of hours each fitter has worked (clocked on to jobs) during a day.

Each fitter has their own gauge and then the first gauge is the aggregated gauge; showing how many hours the team worked in total during the day.

First issue: one of the team worked more than the “maximum” number of hours of 8 in the day (8.16) so as I had set the gauges to be from 1 to 8, his gauge doesn’t show. Is there a way to have the gauge show even if the measure is greater than the max - or to set the min and max dynamically?

Second issue: I have set the aggregated gauge to be from 0 to 48 (being 6 fitters at 8 hours a day - which is the daily target for the team). However, if one of the team are out on leave or out sick (Richie in this case) then my overall target of 48 hours for the day is not correct. How do I get the aggregated gauge to “know” that the daily target is 40 (5 fitters at 8 hours per day) rather than 48 hours (6 fitters at 8 hours per day). Or can the user just enter a value (40) by a slider or something to set the overall aggregated target?

TC

1 Like

Hello Tommy,

For the first issue I think this script will help you. I use it to set up the min and max value for a gauge chart.
debugger;

var res=dataLabel27.container.textContent;
gauge1.control.scale.minimum=res;
var res3=dataLabel26.container.textContent;
gauge1.control.scale.maximum=res3;

I don’t understand very good the second issue but I think you need something dynamically.
You need to have a separate table, or dataLabel which you calculate the target and this table is filtered by team. After this you must take the value and insert it inside the gauge.

1 Like

Thank you Costin…

1 Like

Hi Tommy,

I would tie this to a calendar, as you don’t only have to worry about sick days, but also about statutory holidays, etc. Typically, you generate a planned hours calendar based on working days & stat holidays, but then support entries to negate planned hours for various reasons for absenteeism. You can expose this data in a very simple matrix inside a Dundas Data grid, and, using Dundas’s writeback capabilities, allow users to maintain this data on their own. This would also allow you to report on absenteeism by reason.

With regard to your overage problem for an individual fitter, I would retain the actual hours worked, but use Costin’s solution to set a maximum on the gauge. However, this is not sufficient as it hides a critical piece of data. Additionally, I would use a color (such as red) to indicate when a fitter has gone over. You can either color the gauge needle when this happens, or make a small red icon appear to the right of the gauge’s needle when a fitter exceeds max. You can then put the true hours worked in a tooltip, which is probably advisable in any case. Then, when someone has worked overtime, the viewer is alerted to the situation and can get more details if needed.