Hello,
I’d like to try to clear some of this up. About what changes are or aren’t “global” or propogated: metric sets are primarily defining the data to be displayed by itself and its settings. These settings include everything in the Data Analysis Panel in the Metric Set tab, as well as states (defining the data conditions, not the visual settings), with all of these dialogs color-coded in orange. Default parameter values including the current level are included, but are commonly customized later on using view parameters, for example.
A metric set saves a default visualization with it, but after dragging it onto dashboards/views it can then be visualized multiple times at once with different visualization types and settings, and by different users. Anything in the Data Analysis Panel’s Visualization tab and the entire Properties window for that visualization are not directly part of the metric set and not “global”.
-
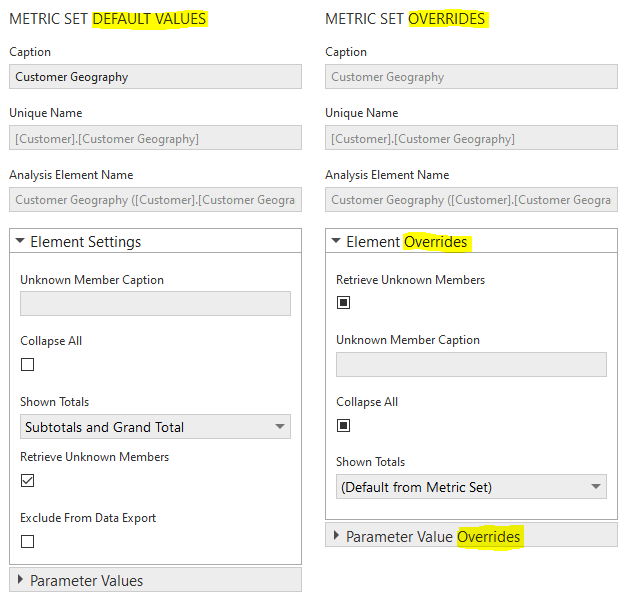
With the check-in/check-out system, changes to the metric set (data) can’t be saved and shared with other users if the metric set is checked in. When opening one of its dialogs, you could watch for “Overrides” in the titles (as opposed to “Default Values”) indicating you’re just overriding the metric set settings like any dashboard viewer can do when everything is checked in. If you don’t have rights to check out a metric set or something else has it checked out, you can at least override it (like a viewer) for analysis purposes, for example.
-
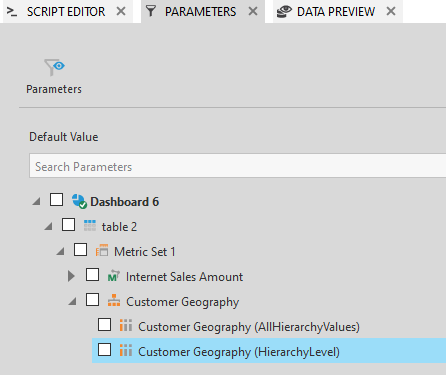
The displayed hierarchy level is exposed as a “parameter” because it’s very common to change it without checking out the metric set. Parameters and filters are most commonly used for “filtering”, but in the Parameters window on a dashboard, expand a hierarchy and you’ll find a hierarchy level parameter:

This view parameter is saved as part of your view (dashboard) if you change its value when editing the dashboard, and this allows you to use one metric set with different hierarchy levels displayed as well as different filter values. There is a hierarchy level filter to go along with this parameter, so you can also add a filter to the dashboard itself, which connects with one of these view parameters, and viewers would then be able to change the level when viewing. (Check the filters for all the other types of parameters that are available.)
@james.davis - you’re not the only submitter of that feature request, but since all metric set (data settings) changes are always “pushed” down already, I think it’s really about pushing the visualization and its settings down to other places that metric set is used. This goes outside my own area, but I think one issue is how to do this right given that multiple users can use a metric set with their own visualization settings.
@matt.cooper - your request seems to be the opposite, where the level change was taking effect everywhere and you didn’t want this, but parameters were meant to solve this case. If you’ve run into a situation where you want to push the same visualization settings to multiple places a metric set is used, please let us know. Or if there are other things people want to change about a metric set without checking it out or propogating those changes, please let us know about those scenarios as well (but I think we may have to consider that separate).


