Making Report/Dashboard-Level Changes "Stick"

Newbie requesting some guidance.

I have a metric set that returns the total number of tickets by Date_Entered (which is a datetime). I have a timespan applied to that field, so I can pick all the appropriate levels. On the metric set itself, I have the level set to Day since that’s what I use on one of my dashboards.

I now want to re-use that metric set on another dashboard, but I want the level to be Month, not Day. So, I check out that 2nd dashboard, change the level and all looks good, but when I check in the dashboard it reverts back to Day.

Surely I don’t need to create a 2nd metric set with a different level… if the option to pick the level exists on the dashboard, so why even display it if it won’t save when I check in the dashboard? Am I missing a checkbox for dashboard-level override? Am I just not understanding how the data flow?

As always, any insight is greatly appreciated.

-Matt

Did you checkout the metric set?
Changing a metric set on a checked out dashboard does not stick for a checked in metric set.

This is my Understanding of what is happening.

Metric Set - is the base
On the dashboard it has a copy of the Metric Set as it looked when you added to the Dashboard.

When you make changes to the “LOOK” of the Visualization the metric set is (I think even what kind of vis, in most cases) to the Metric Set it self or while it is on the Dashboard those kind of changes to not propagate to the base or copies.
If you add a Measure that Change will change the copies as well.

I think changes to Level of Hierarchy and filters are include in the LOOK, how data is displayed. because this did not change what columns are displayed it did not propagate to all the copies.

This is why I have requested for a way to make these kind of changes to the actual Metric Set and then be able to Pick what Copies get those changes with out having to go make them on each dashboard or Remove it and re add it and then set up the filters all over again.

I have learned to get my Metric Set right before it goes on a a second Dashboard but still not always successful with that.:scream:

You both appear to be 100% correct.

I can change SOME aspects perfectly fine (for example, one place where the metric set is used is a line graph and the other is a bar graph), but other aspects (apparently mostly in the data analysis panel) appear to be global changes - I need to check out the metric set, make the change on the dashboard, then the metric set itself will change.

There are two problems with this that Dundas REALLY needs to look at.
1 - If the metric set isn’t checked out, I should no be able to muddle about in the data analysis panel, or at the very least I should get a warning that what I’m about to do totally isn’t going to work. Why give me access to goodies that are just going to revert when I save??
2 - If the official Dundas line is that we should be re-using metric sets whenever possible, we need more freedom to make minor changes like this. I apparently have to now clone my metric set and make a copy that 99.9% identical except for that one little grouping setting in order to make both my dashboards work. That’s horribly inefficient and goes against Dundas’s own published best practices.

I agree with both of your comments @matt.cooper.

I think they are both already feature requests, as I definitely remember them being mentioned before. If not, I’ll gladly add my name to them.

Although I kind of understand why the 2nd point is as it is. Metric sets are reused data formats, which can be displayed differently. If you are making a change to the format of the data - however small it may seem to you - it is a different metric set from a data perspective. Otherwise where do you draw the line.

I posted in the feature request about this long time ago but no one posted that they also wanted this so Dundas thought i was the only one that wanted this and has put it at the bottom of the list.

https://dundas.influitive.com/forum/t/updating-metric-set-bottom-up-exist-but-what-about-top-down/757/21

This was before I fully knew what all mad global changes.
@matt.cooper you can see here that Ariel was saying make a new copy as the solution.

Now go vote it up, and reply on that post and put this post in you reply on that thread

Hello,

I’d like to try to clear some of this up. About what changes are or aren’t “global” or propogated: metric sets are primarily defining the data to be displayed by itself and its settings. These settings include everything in the Data Analysis Panel in the Metric Set tab, as well as states (defining the data conditions, not the visual settings), with all of these dialogs color-coded in orange. Default parameter values including the current level are included, but are commonly customized later on using view parameters, for example.

A metric set saves a default visualization with it, but after dragging it onto dashboards/views it can then be visualized multiple times at once with different visualization types and settings, and by different users. Anything in the Data Analysis Panel’s Visualization tab and the entire Properties window for that visualization are not directly part of the metric set and not “global”.

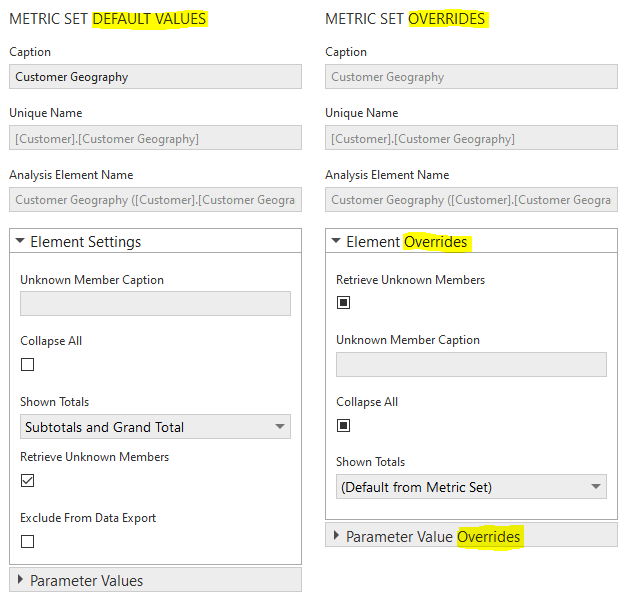
  1. With the check-in/check-out system, changes to the metric set (data) can’t be saved and shared with other users if the metric set is checked in. When opening one of its dialogs, you could watch for “Overrides” in the titles (as opposed to “Default Values”) indicating you’re just overriding the metric set settings like any dashboard viewer can do when everything is checked in. If you don’t have rights to check out a metric set or something else has it checked out, you can at least override it (like a viewer) for analysis purposes, for example.

  2. The displayed hierarchy level is exposed as a “parameter” because it’s very common to change it without checking out the metric set. Parameters and filters are most commonly used for “filtering”, but in the Parameters window on a dashboard, expand a hierarchy and you’ll find a hierarchy level parameter:
    level%20parameter
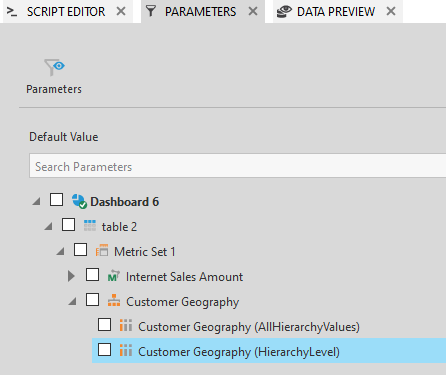
    This view parameter is saved as part of your view (dashboard) if you change its value when editing the dashboard, and this allows you to use one metric set with different hierarchy levels displayed as well as different filter values. There is a hierarchy level filter to go along with this parameter, so you can also add a filter to the dashboard itself, which connects with one of these view parameters, and viewers would then be able to change the level when viewing. (Check the filters for all the other types of parameters that are available.)

@james.davis - you’re not the only submitter of that feature request, but since all metric set (data settings) changes are always “pushed” down already, I think it’s really about pushing the visualization and its settings down to other places that metric set is used. This goes outside my own area, but I think one issue is how to do this right given that multiple users can use a metric set with their own visualization settings.

@matt.cooper - your request seems to be the opposite, where the level change was taking effect everywhere and you didn’t want this, but parameters were meant to solve this case. If you’ve run into a situation where you want to push the same visualization settings to multiple places a metric set is used, please let us know. Or if there are other things people want to change about a metric set without checking it out or propogating those changes, please let us know about those scenarios as well (but I think we may have to consider that separate).

That is why I suggested when you make changes you then have an option (maybe you have to right on the checked in version of the metric set click to start this optional process) that you can pick what copies get these changes.

My request is the same as James. The metric set has a level of Day and Dashboard 1 has a level of Day, but if I add that MS to Dashboard 2 and change the level on the dashboard to Month, that change is lost when I check in the dashboard. (Naturally, if I make the change on the metric set, then Dashboard 1 also flips to Month which I don’t want either.) I’ve had to clone the metric set, set the 2nd metric set to a level of Month, then add that 2nd metric set to Dashboard 2. It’s not the end of the world, to be sure, but it’s just adding more object that I have to take care of (or update should there be a large change to our data collection or display parameters).

You can change the level of a hierarchy separately per dashboard by using parameters (#2 above). These parameters are available specifically so you can change the level without checking out the metric set. Can you please let us know if this doesn’t work for you?

1 Like

When you reuse the same metric set in multiple places, though, there are not copies of the metric set - there really is only one. There are only copies of the visualization, and that request makes sense to be able to “push” (or “pull”) visualization changes to other places that metric set is used.

Preventing certain changes to the metric set from propagating (besides the visualization) to all the places it’s used raises questions and problems for us, especially when metric set changes can include adding, removing and reordering elements, as well as a wide variety of settings. I think it would help if you had any examples of what types of changes to a metric set you would not want to affect everywhere it’s used. When those settings are filtering and the displayed hierarchy level, it would also help if we could understand how parameters are not helping with those cases.

It works! Sorry, I’d completely mis-read that point. I submit that it’s a rather clumsy and counter-intuitive way of accomplishing that task, but so long as I can get to the end result I’ll shut up.

Thank you for the help!

Good to know it’s working for you and I’ll pass on the feedback, thanks