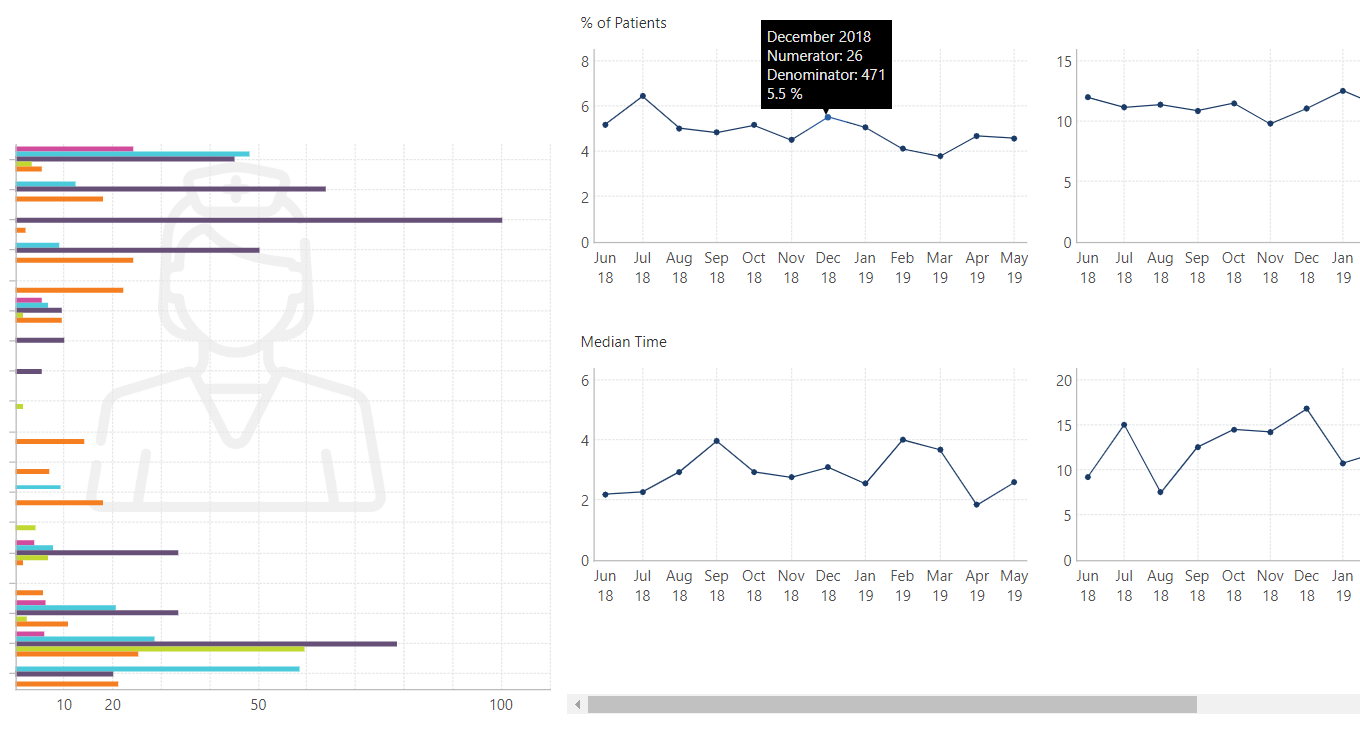
We are developing a dashboard that contains quite a few indicators, and these indicators are grouped into different areas. Currently we allow users to select a certain area and then see trends for all indicators within this area. This is done using small multiples.
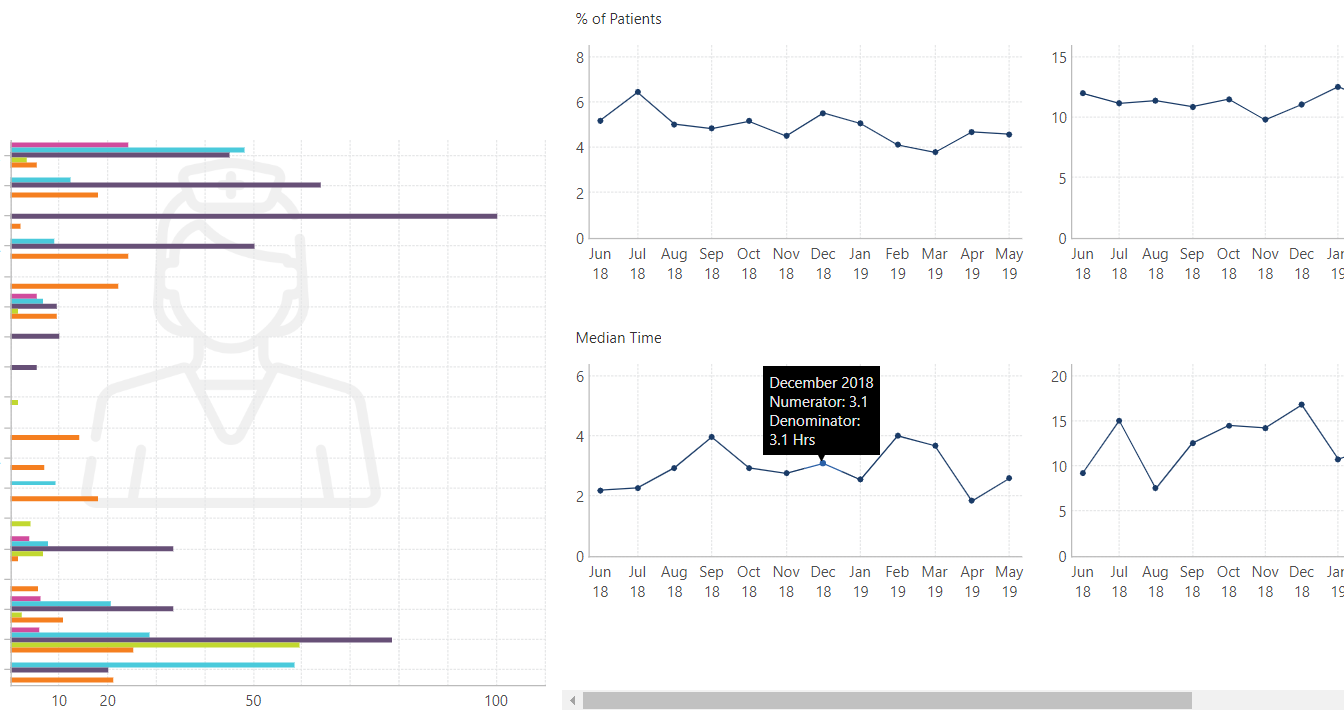
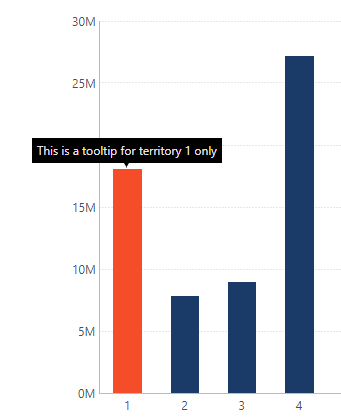
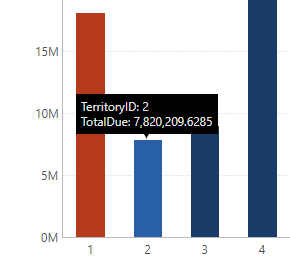
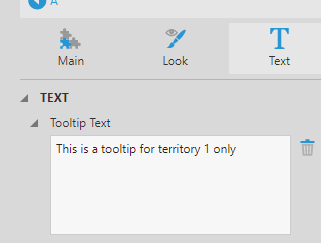
Everything worked well except one thing - not all indicators within an area share the same value type (i.e. Counts, Percentage, etc.). Users have asked for showing Numerator and Denominator in tooltips for Percentage indicators and just the number for Counts indicator.
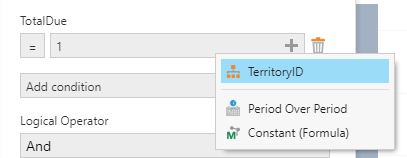
We didn’t find where we could add a separate cell within the small multiples (the same concept where scorecard allows us to add a separate group), and the tooltip text itself seems not open to customization. Would anyone know how to implement this? The best we got so far is as below and the users are not satisfied with it…