How to calculate ytd % in dundas

We have a requirement to calculate the ytd% i.e. to do period over period analysis till date. 
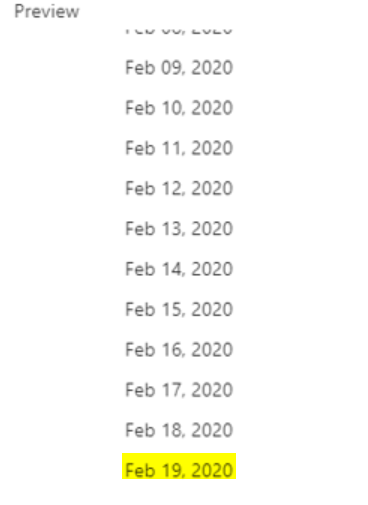
 We have to fetch the data till current date (e.g. today’s date 19th) and for previous year 2019 although the data is available for entire year (entire quarter  for Q1 till march) , I should compare the data till 19th Feb 2020 to 19th Feb 2019. This functionality is not working as expected.

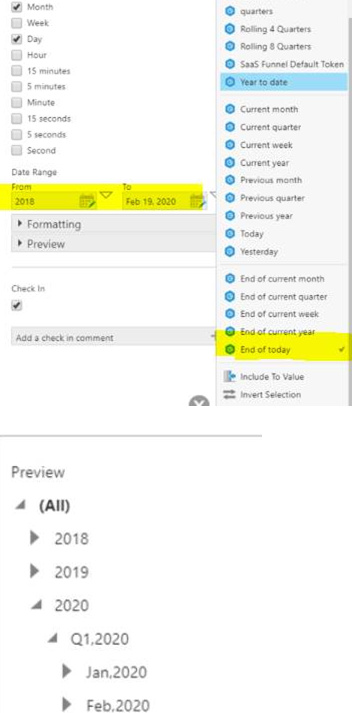
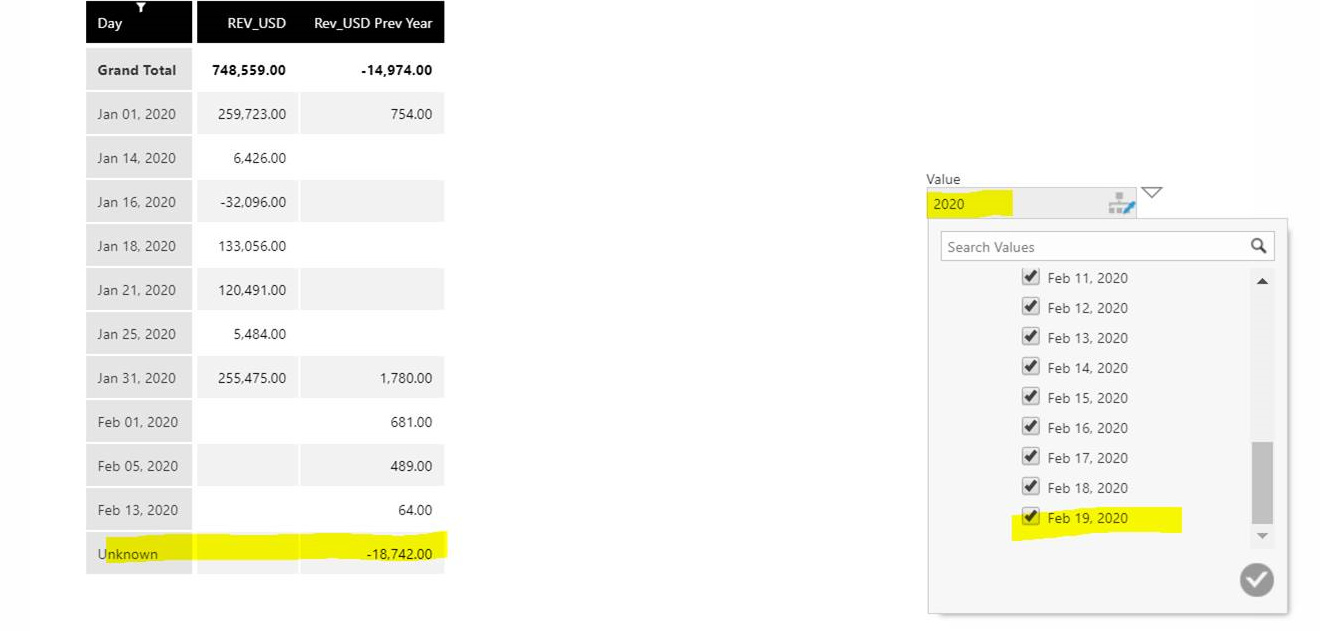
We modified the time dimension to fetch the data till current date and for 2020 now we are seeing data till 19th feb only but somehow ‘unknown’ value is coming. We don’t know the exact reason for it. If you select the month separately this ‘unknown’ value is not coming. How this can be done dundas?

Below are the screenshot:

Time Dimension:


Hi Mitsu,

The unknown values that are being returned are all of the values that don’t fit into the dimension range that you are defining. Dimensions are not filters and all the values are still going to be returned to you, just bucketed into ‘unknown’. To accomplish what you are asking, create a filter and set a token that gives data from the ‘beginning of this year’ to the ‘end of today’. Once you are showing only today’s data, use period over period to show last year during the same time.

Here is a video that I did on tokens, it won’t do exactly what you need but gives a nice overview of tokens.
https://www.dundas.com/resources/videos/use-tokens-to-make-your-dashboards-smart

Thanks Jeff for response. We dont want user to select the token , what we need is when the current year is selected (2020) by default yty% should be till today. How will we make that dynamic because users can select the data for 3 years so they can select anything like 2018/2019/2020 and in our db data for 2018,2019 is already there (entire years ,hisotry data) only for current year it will load data till date.

There’s a few ways to approach this but i’m guessing that your issue is that you want to make it easier so that your users don’t need to touch tokens/filters?

You could always handle this for them using some preset options and layers. Instead of putting a filter on the dashboard, create the metric set using the metric set filter that isn’t provided to the user and just build a few versions. Build a “This Year”, “Last Year” etc… and let the user toggle between the ones that are displayed using layers.

Another approach would be to add buttons to the dashboard and have each run a script to change the values being shown by modifying the filter behind the scenes.