Filter applied on chart with PoP

Hi guys,

I have the following situation:
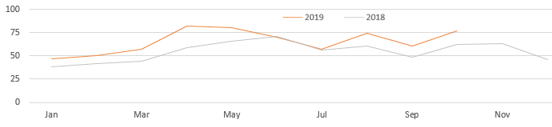
Withing the chart below I have two lines. The second one (gray) is calculated via period over period function.
What I want to achieve is to apply a range filter on the chart, lets say from March to November, and the orange line to display only values from this interval, while the PoP line (gray) would have all the values in the previous year (will show the whole year).
Currently when I apply the filter, it changes both lines, and reduces the bottom axis to the interval which I`m selecting.
The bottom axis will always display the whole year (all the month), the pop line will always start from Jan and end on Dec, and the actual line will have values depending on the range which is applied to the filter.

image
Any ideas?
Thank you so much.

This is an interesting use case. my first thought is that the PoP is so tightly tied to the main measure that it is always going to do that so what I might try is making another Metric set that is the same (OK copy the original).
You can have both metric set on one visual on Dashboard, then set the New Copy filter to one year back. Then I would figure out the scripting that when you changed the main measure filter to check what year it is and set the NEW one to one year before that. (unless the main is always going to show something in current year then the previous year will just always work.

Dont forget to line change the color on the new one to grey.

I am interested to hear if there a more efficient way but this is how I would hack it.

Thank you James! Great idea. This is exactly what I thought and tried also.
The only problem is that:

  • I have only one date range filter that should influence both metric sets, but the first one is set to month level and the second should be on year level
  • if I change the Level to Year at the second metric set, it will automatically change to year level to the first metric set, so my data will show aggregated by year not by moth as I would like.

In these cases, I added another column in the database as a string with the year extracted from the date column. Now I`ve extracted the year from the date range calendar and I am trying to send it to another filter that would filter the new column with the year shown as string, which is placed in the slicer of the second metric set.
Another problem now is that I should send to this filter both the string value of the current year and the year before, because if I send only the current year, both lines from the chart will stop at the latest month of the current year…

Have to tried to give the Fake New PoP its own parameter filter and use a script to change it based on when you change the Filter for the main Measure, instead of linking both them together?
My though was if main filter change, just get form it what year it was in and then change the PoP parameter to one year before that, no need to actually have a visual filter just a parameter that only links to the PoP measure.

James put you on the right track with a second metric set on the same visualization. Here are the steps I would take to implement this:

  1. create your current results series as you normally would
  2. open the data analysis panel and add another metric set to your chart by clicking on the + icon next to the metric set name
  3. drag the same measure and time dimension element to the same bindings as in the original
  4. add a period over period for the measure in second metric set. set it to go backwards for 12 months (if month is your grain level)
  5. hide (uncheck the visible checkbox) the main measure series in your second metric set so you only see the period over period series in that metric set
  6. add a range date filter and connect it only to the date dimension in the first metric set
  7. add another range date filter and connect it only to the date dimension in the second metric set. You can keep it visible it first but after step 8 you should delete the control but keep the view parameter for it
  8. add a script to the parameter value changes interaction of the first filter you added in step 6. this script will need to read the year value from the new selected value and set the start and end date of the second filter you added in step 7 to the beginning and end of that year. To get the value selected by the user on the first filter you can use a script similar to this one and to set the value of the second filter you can use a similar script to this one. There is also a good general summary article about the how to Modify a filter / view parameter using scripting.

Here is a small video the shows steps 1-7 so you can quickly get started and get to the script point: https://dundas.sharefile.com/d-s1ff258739dc48589

The one caveat to the solution above is if the user is choosing a range of values which span across more than 1 year - for example, if he is choosing data from Dec 2017 to May 2018. The solution to this case will depend on how you want to handle the experience for the user but should be possible either way using the steps above.

1 Like

Thank you!
Good opinion. Have tried it and it works. The only difference is that I have send the year from the first filter to a member filter which is filtering a column I have added in the cube, as a string, with the year extracted from the date.