Hey everyone,
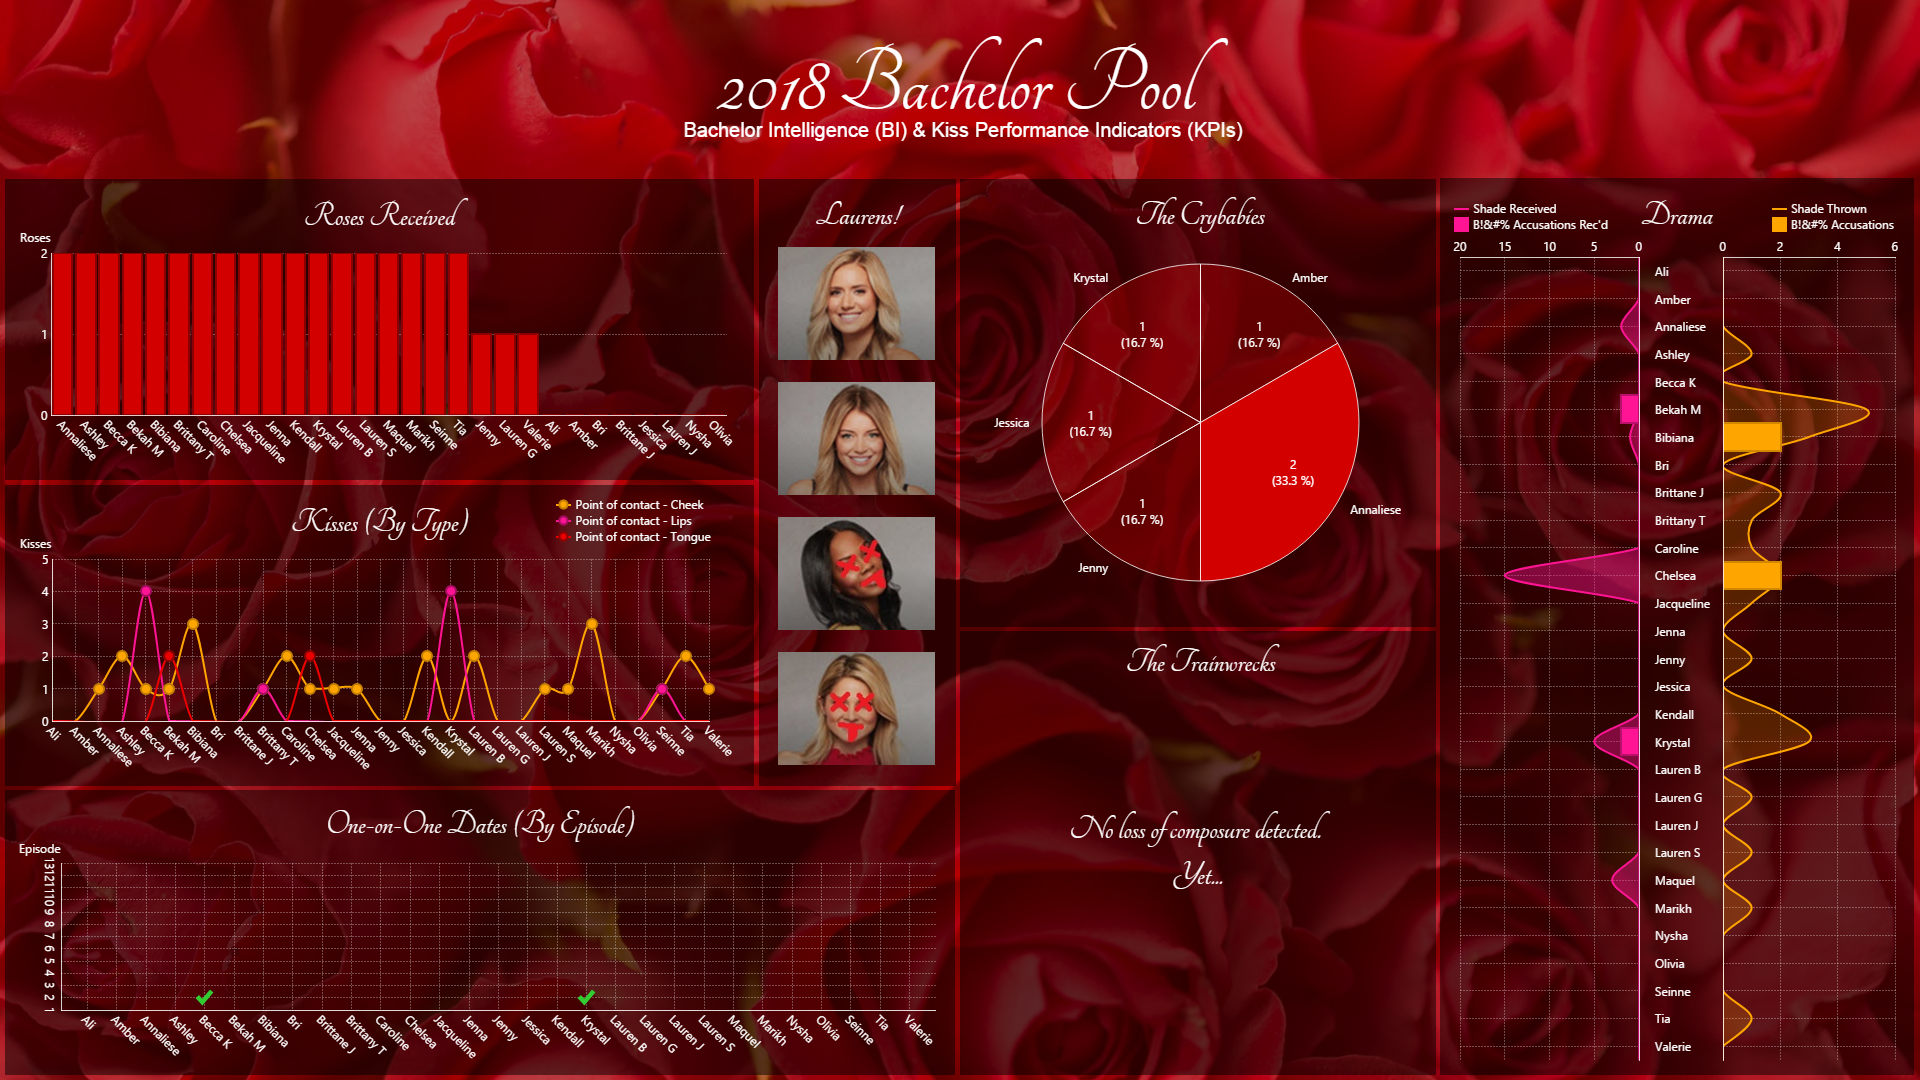
I don't get to share too many of the dashboards we at Absorb LMS create for our clients as they often contain both sensitive user information as well as client branding that we do not have authorization to share publicly. However, with the start of the new season of "The Bachelor" we've got a little bit of a pool going at work with a few different bets on who will go the furthest, and for fun I whipped up a little dashboard to track our numbers.
This is all powered off of a single Excel spreadsheet uploaded to Dundas as a data connector. Every episode I'll write down each of my metrics with various "Types" that are used to perform selective filtering for each visualization in the dashboard. Then I just have to re-upload the updated spreadsheet once a week and the dashboards are refreshed.
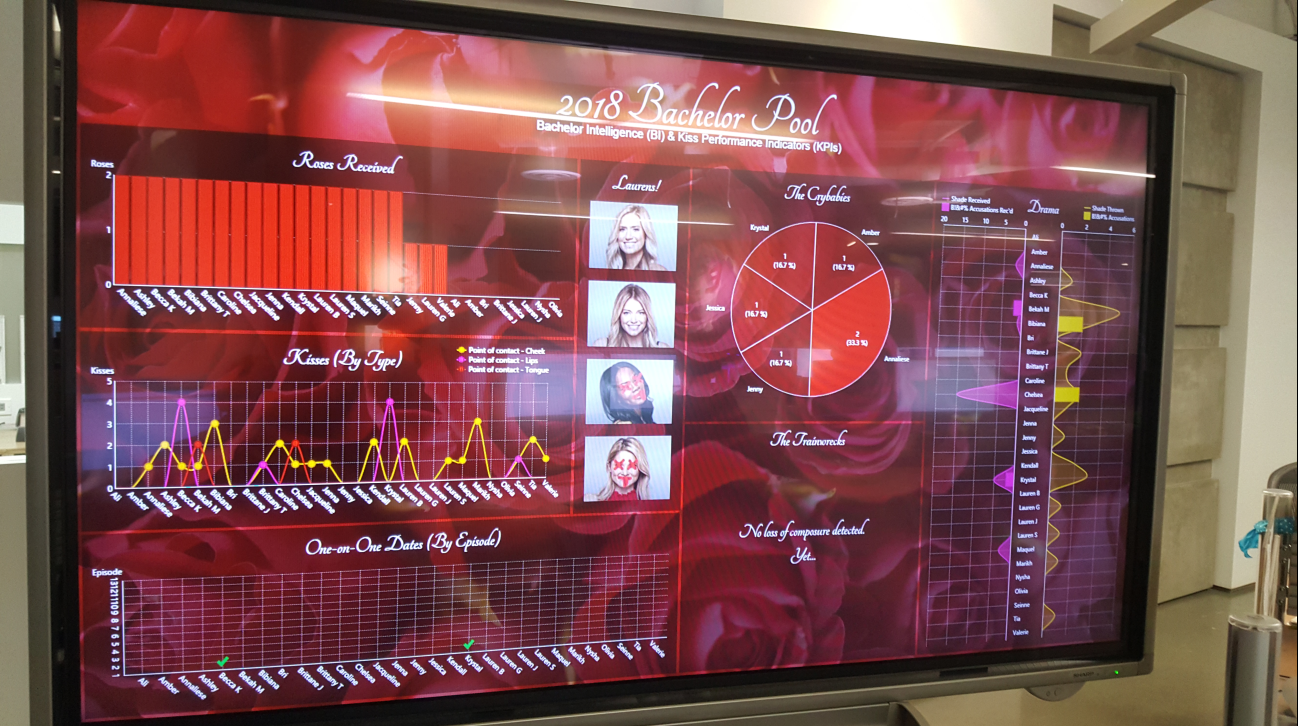
We've got it up on the big screen in the office... people love it!
Ryan
.png)