Area chart displays strangely

Hi all,


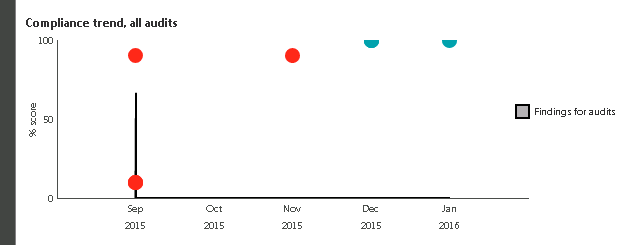
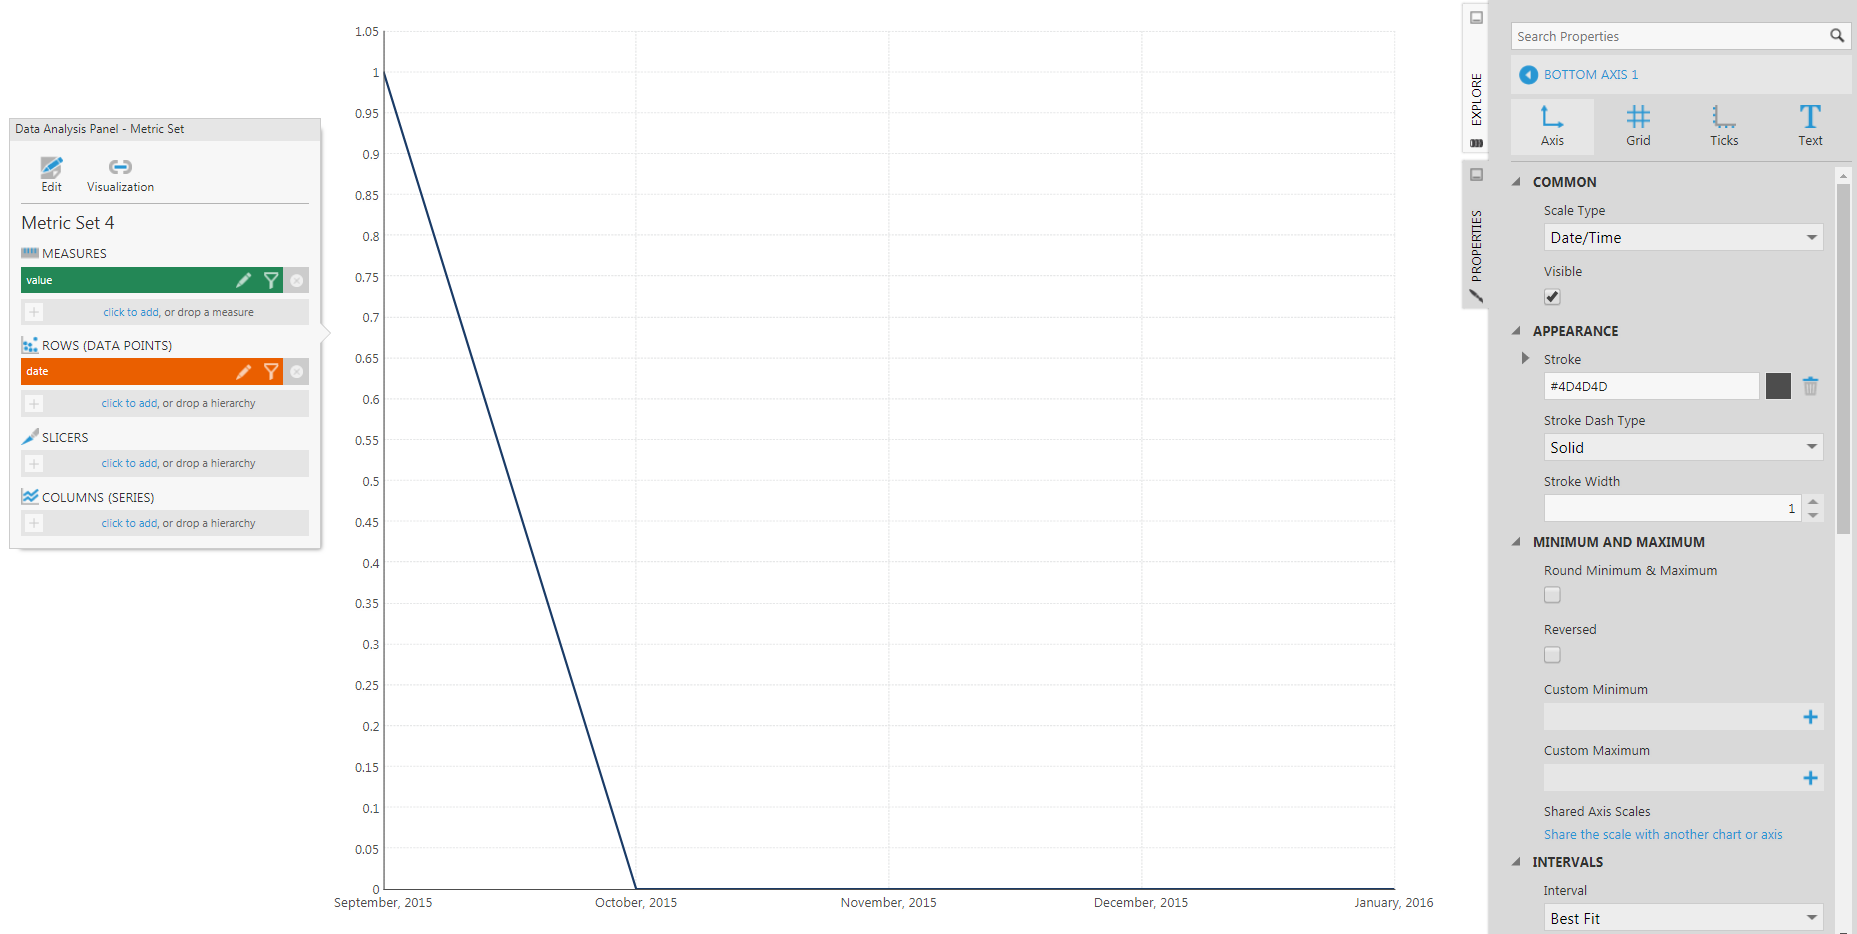
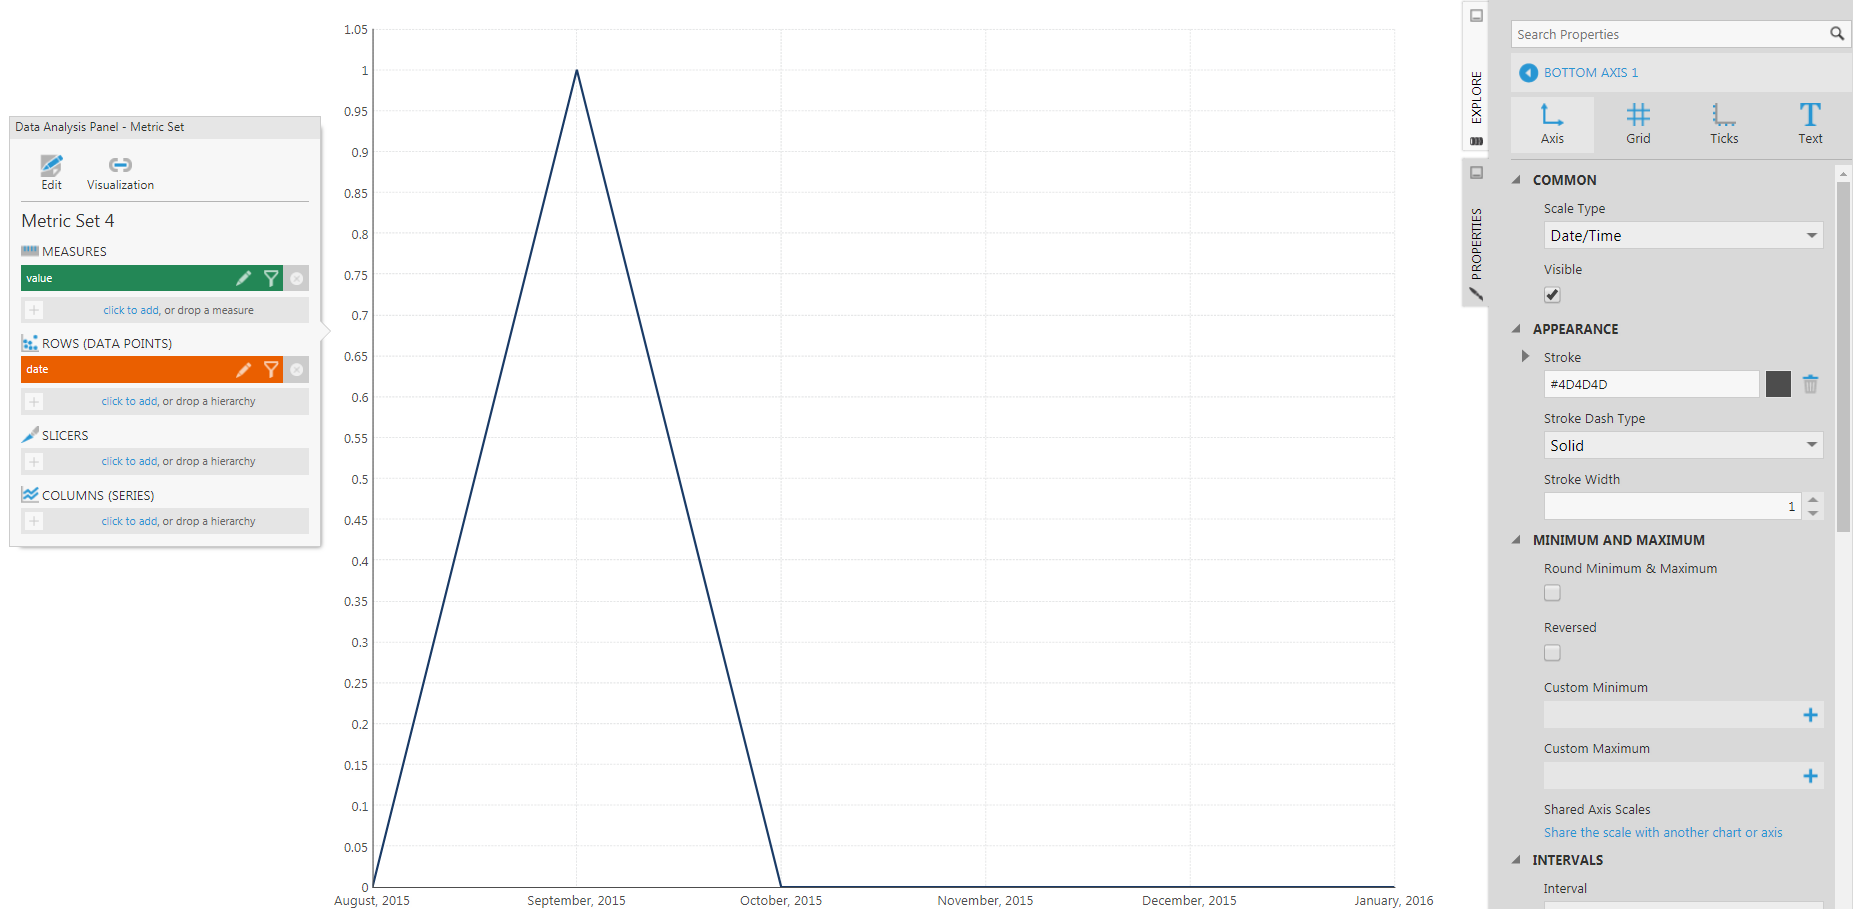
I've got an area chart in one of my dashboards that appears to be displaying the correct data, but it's doing it in a way that I find odd. The chart is a count of records vs the date they were created, using months as the interval. I've got 0 records in most months, but one of them (September) has 1, so I'd expect for this trivial case, to get a triangular formation in the chart, with August (Which is actually at the y-axis) and October at 0, and then a line going up to 1 for September. What I get is a sort of inverted T shape. The line goes up for September, but it seems to go up straight from the September tick, and straight back down again. There is only data for the 1st of every month. I can sort of see why the chart looks the way it does, but it's not what my users will expect to see. The x-axis is defined as a date/time axis right now, and I've tried changing it to other types, but none of them seem to do what I expect either. I've included a screenshot below. I'd expect a triangle from the origin to (Sep 2015, 1) and down again. The area chart is a second series laid underneath a bubble chart, so fiddling with the axes might have knock-on effects. I hope I'm explaining this well enough and that someone out there can see what I mean.


Image title


Hi Adam,


For a case such as this one, the line always starts from the 0 of the previous data point, goes to 1, and then drops to 0 again. So you should always see a triangle formed. Is the data on your chart showing day level data? The straight line you see is actually all the points in September trying to fit into that one spot. If you zoom in or filter, you should see a proper triangle.


In order to get the data points to start from the Y-Axis, you need to uncheck the "Round Minimum & Maximum" property of the Bottom Axis. Please see the screenshot below to know where to find it:


Hope this helps. Please let me know if you have any questions.


Thanks,

Nikhil

Hi, sorry to be a pain, and sorry for the late reply, I've been off sick for a few days. I unchecked the "Round Minimum & Maximum" box and unfortunately it made no difference, however I'm less worried about that than I am the shape of the data. There is only one data point for each month, so I have literally 5 items of data for the chart above. In a table, they'd look like


month value

September 1

October 0

November 0

December 0

January 0


I'm not sure how I'm getting the shape I'm getting with that data. I hope somebody can see where I've gone wrong. In the meantime, I think I'm going to take the approach of building a new chart, not associated with an existing visualisation and see what that gets me. I'm not sure what's screwing things up, but this is the first time I've tried showing two different chart styles in one visualisation, so that seems a good place to start.

Hi Adam,


The second series might be affecting the vew you're getting. Easy way to test this is to create a new chart and see if you get the same result. Let me know what you find.


Based on the above data, I got the result below on a line chart using these steps:

- Drag and drop value and date columns on the metric set canvas

- Replace the date column with a time dimension

- Uncheck the Round Minimum and Maximum option:


If you include August in your data as well, then you can get a proper triangle as below:


Regards,

Nikhil